Uploads by EPRI ADMIN
From EPRI GO&P Resource Center
This special page shows all uploaded files.
| Date | Name | Thumbnail | Size | Description | Versions |
|---|---|---|---|---|---|
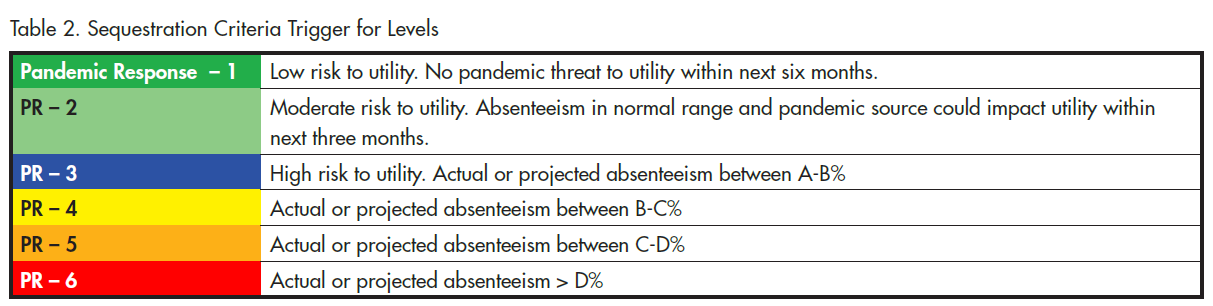
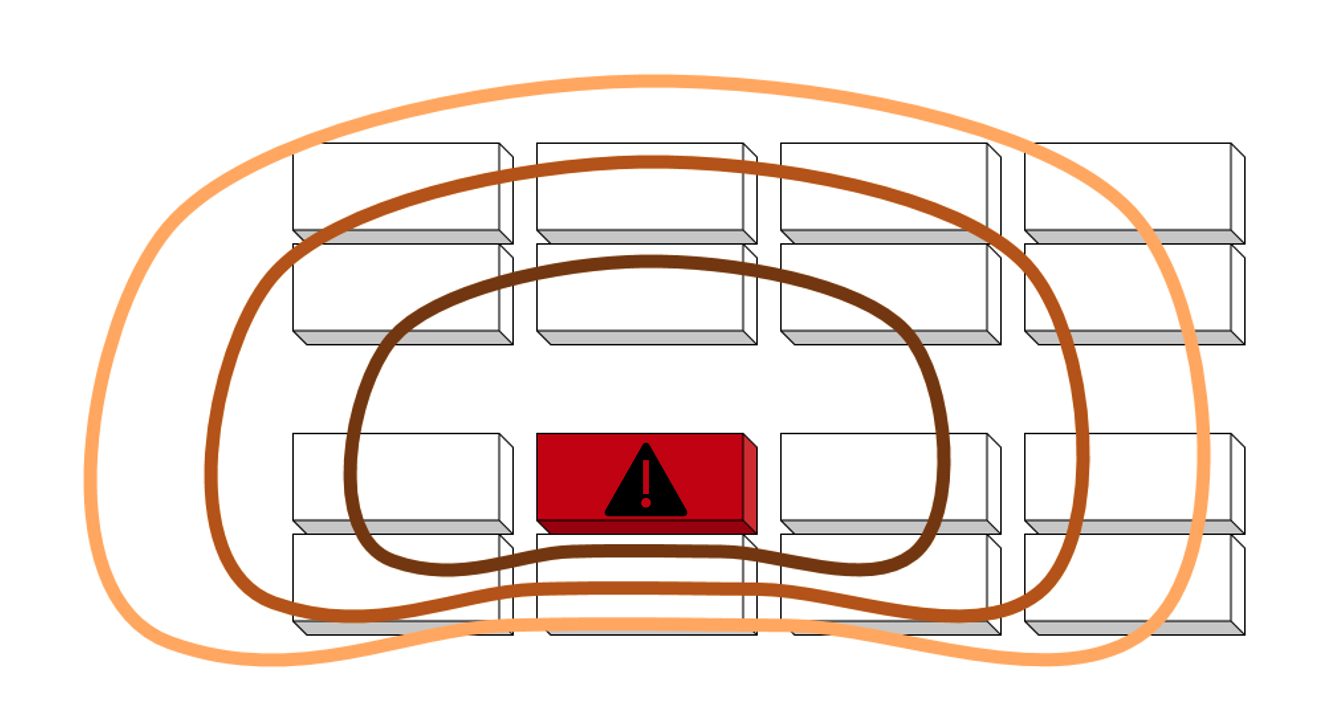
| 13:43, 4 November 2021 | Sequestration table decision protocols.png (file) | 66 KB | 1 | ||
| 06:53, 26 October 2021 | Pandemic Summary3.png (file) |  |
1.09 MB | 1 | |
| 06:30, 26 October 2021 | Pandemic Summary2.png (file) |  |
632 KB | 1 | |
| 06:07, 26 October 2021 | Pandemic Summary.png (file) |  |
1.07 MB | 1 | |
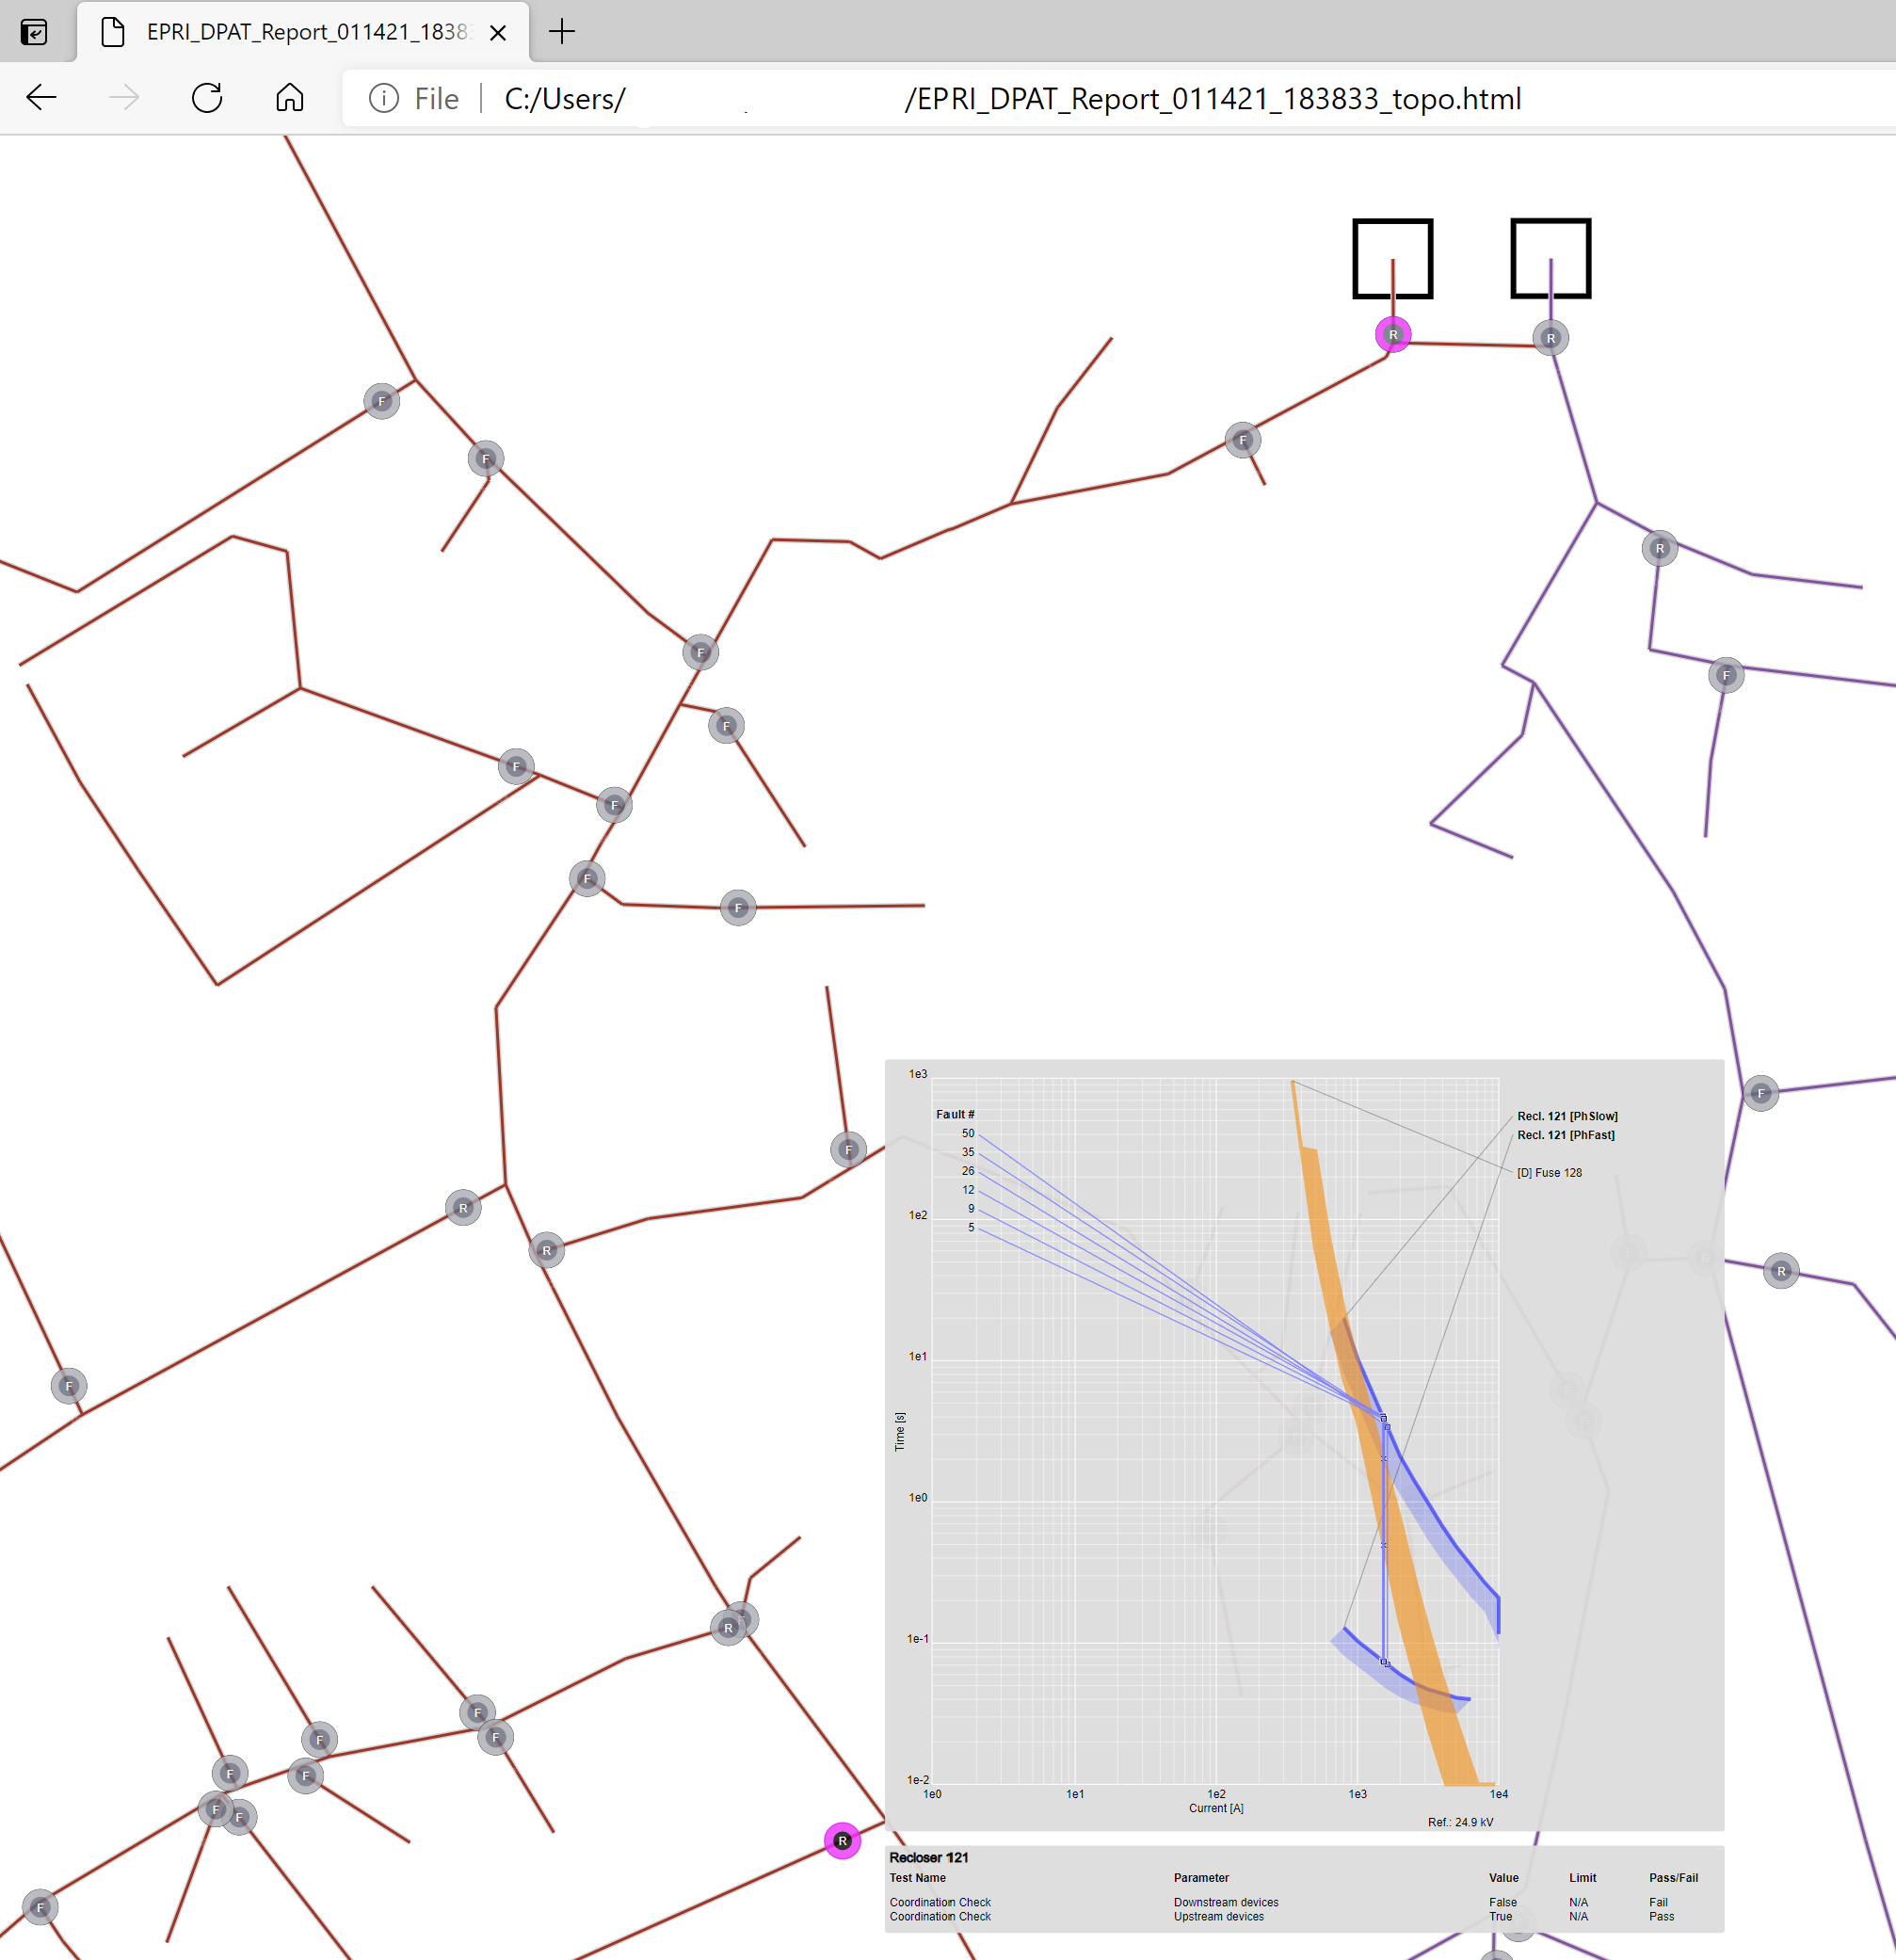
| 05:04, 25 May 2021 | DPAT SLD Results File - recloser TCC.png (file) |  |
510 KB | 1 | |
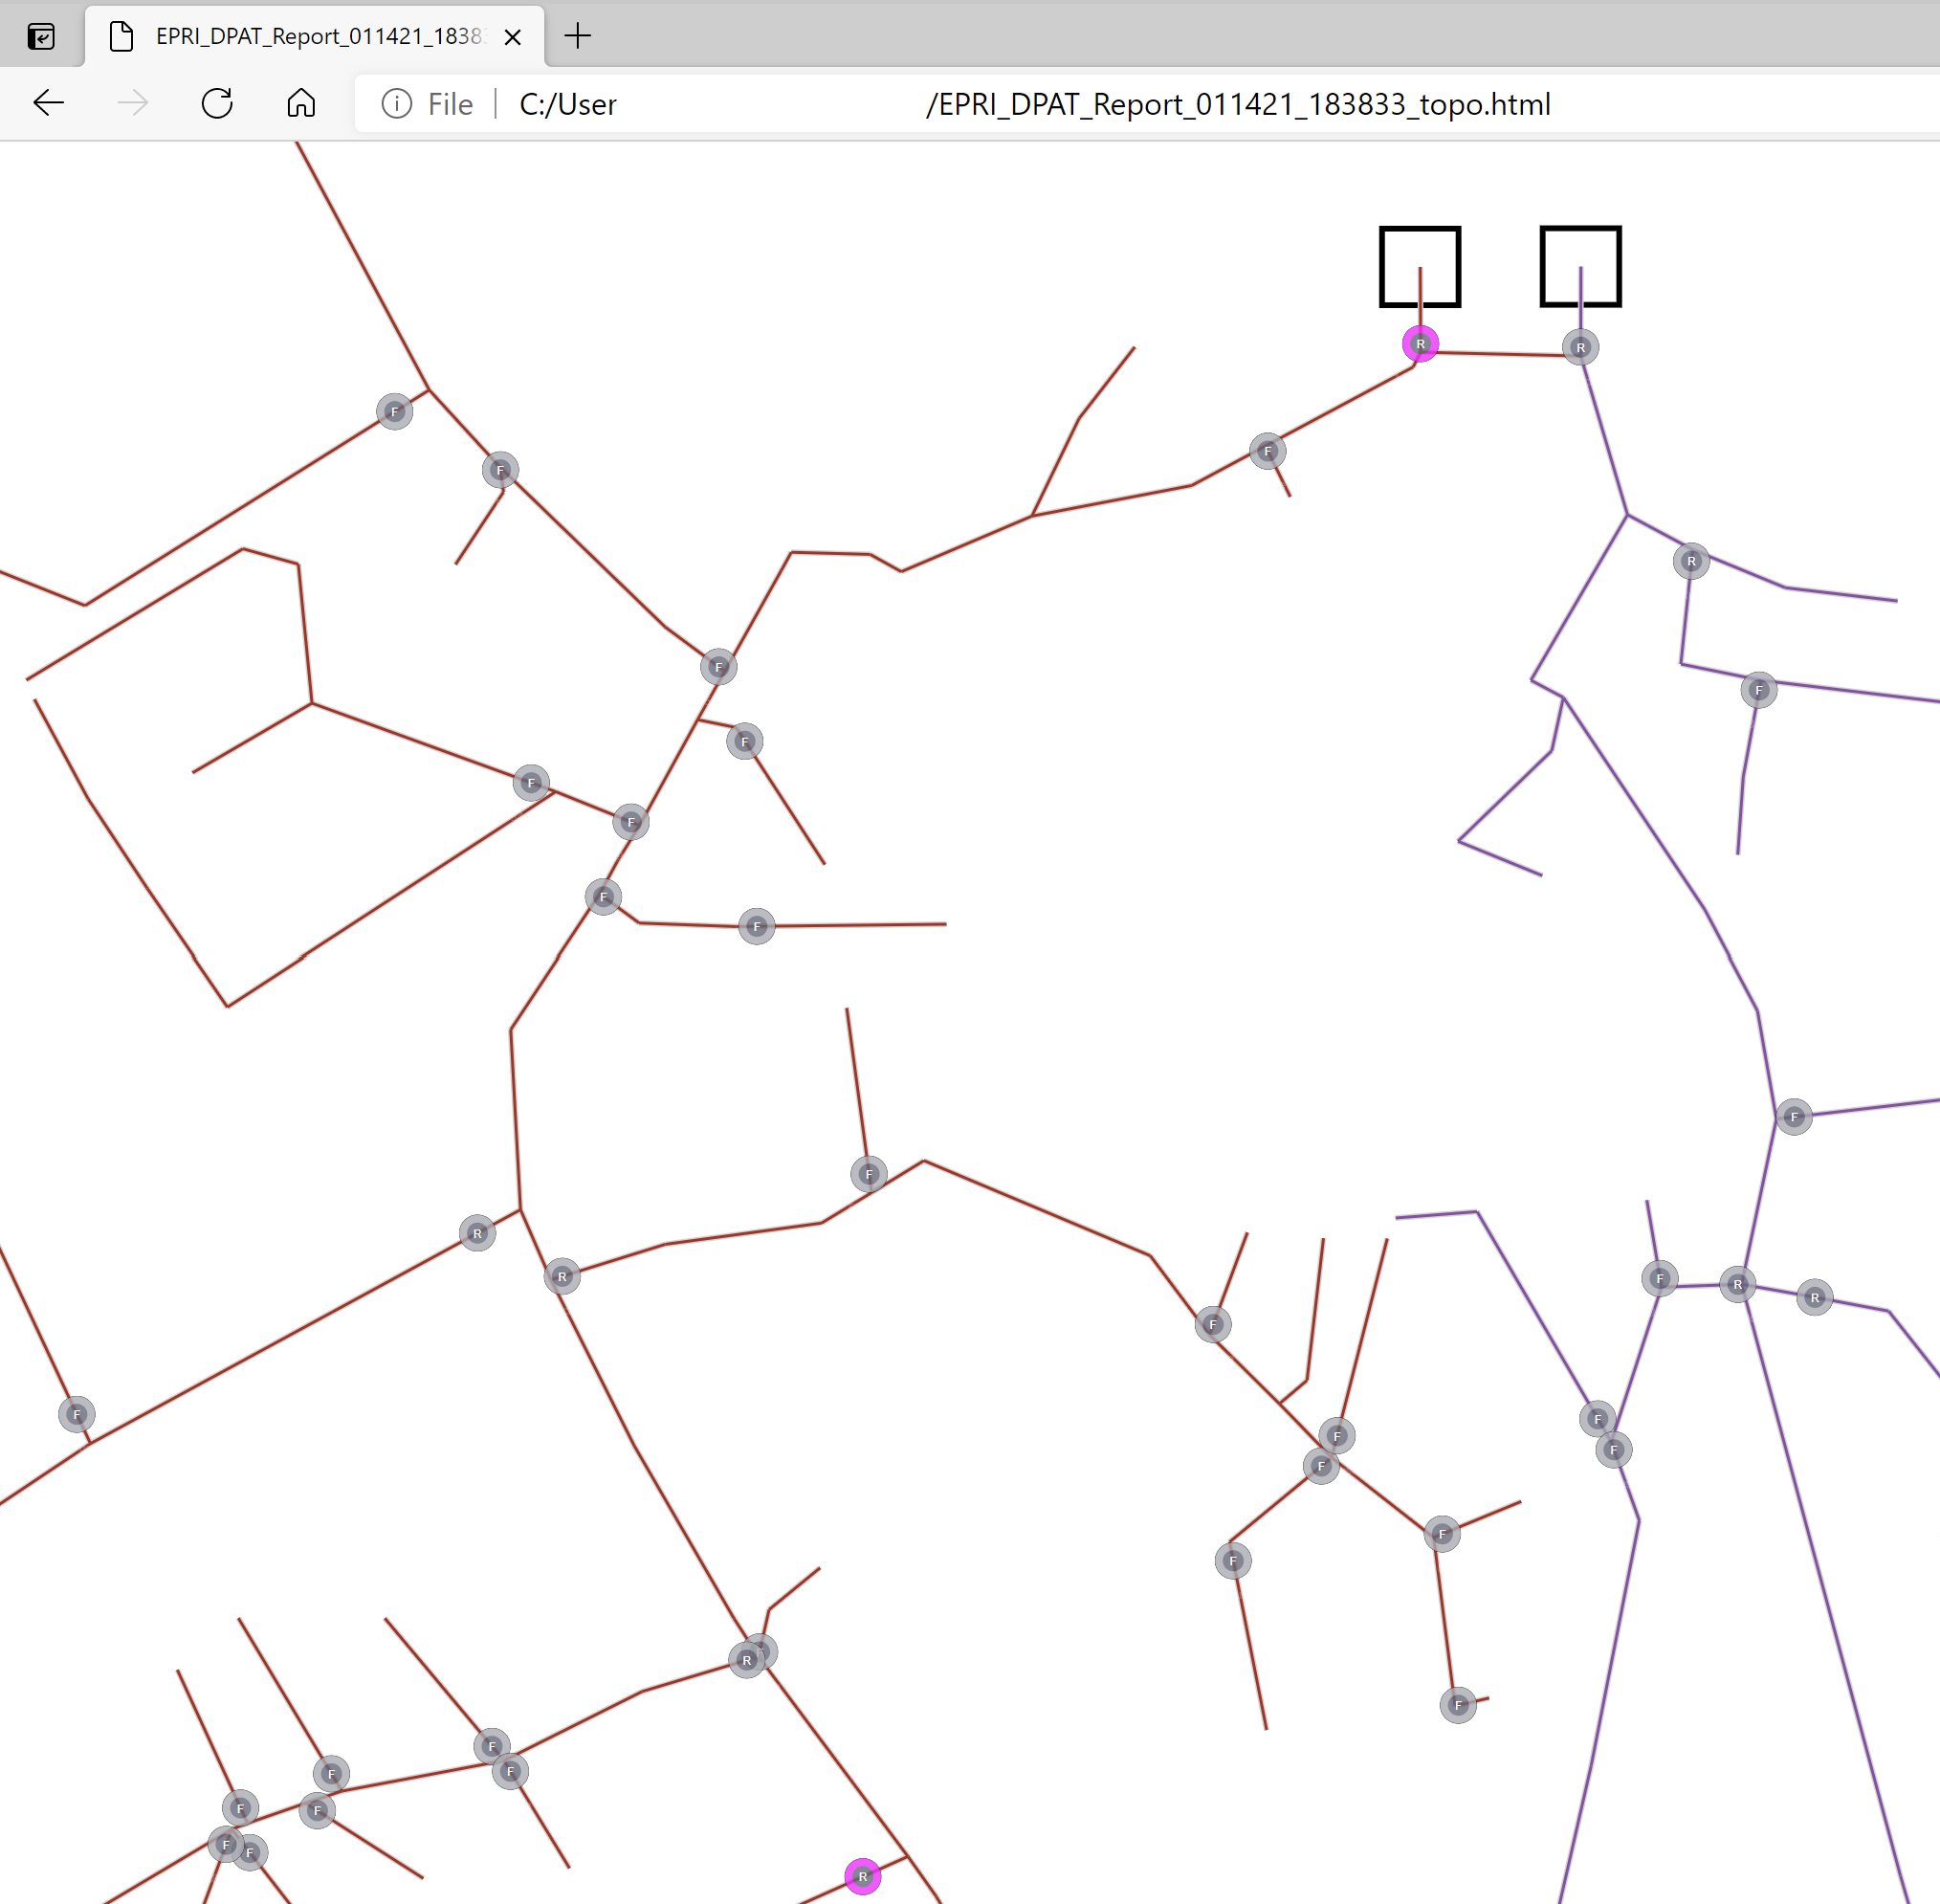
| 05:03, 25 May 2021 | DPAT SLD Result File.png (file) |  |
413 KB | 1 | |
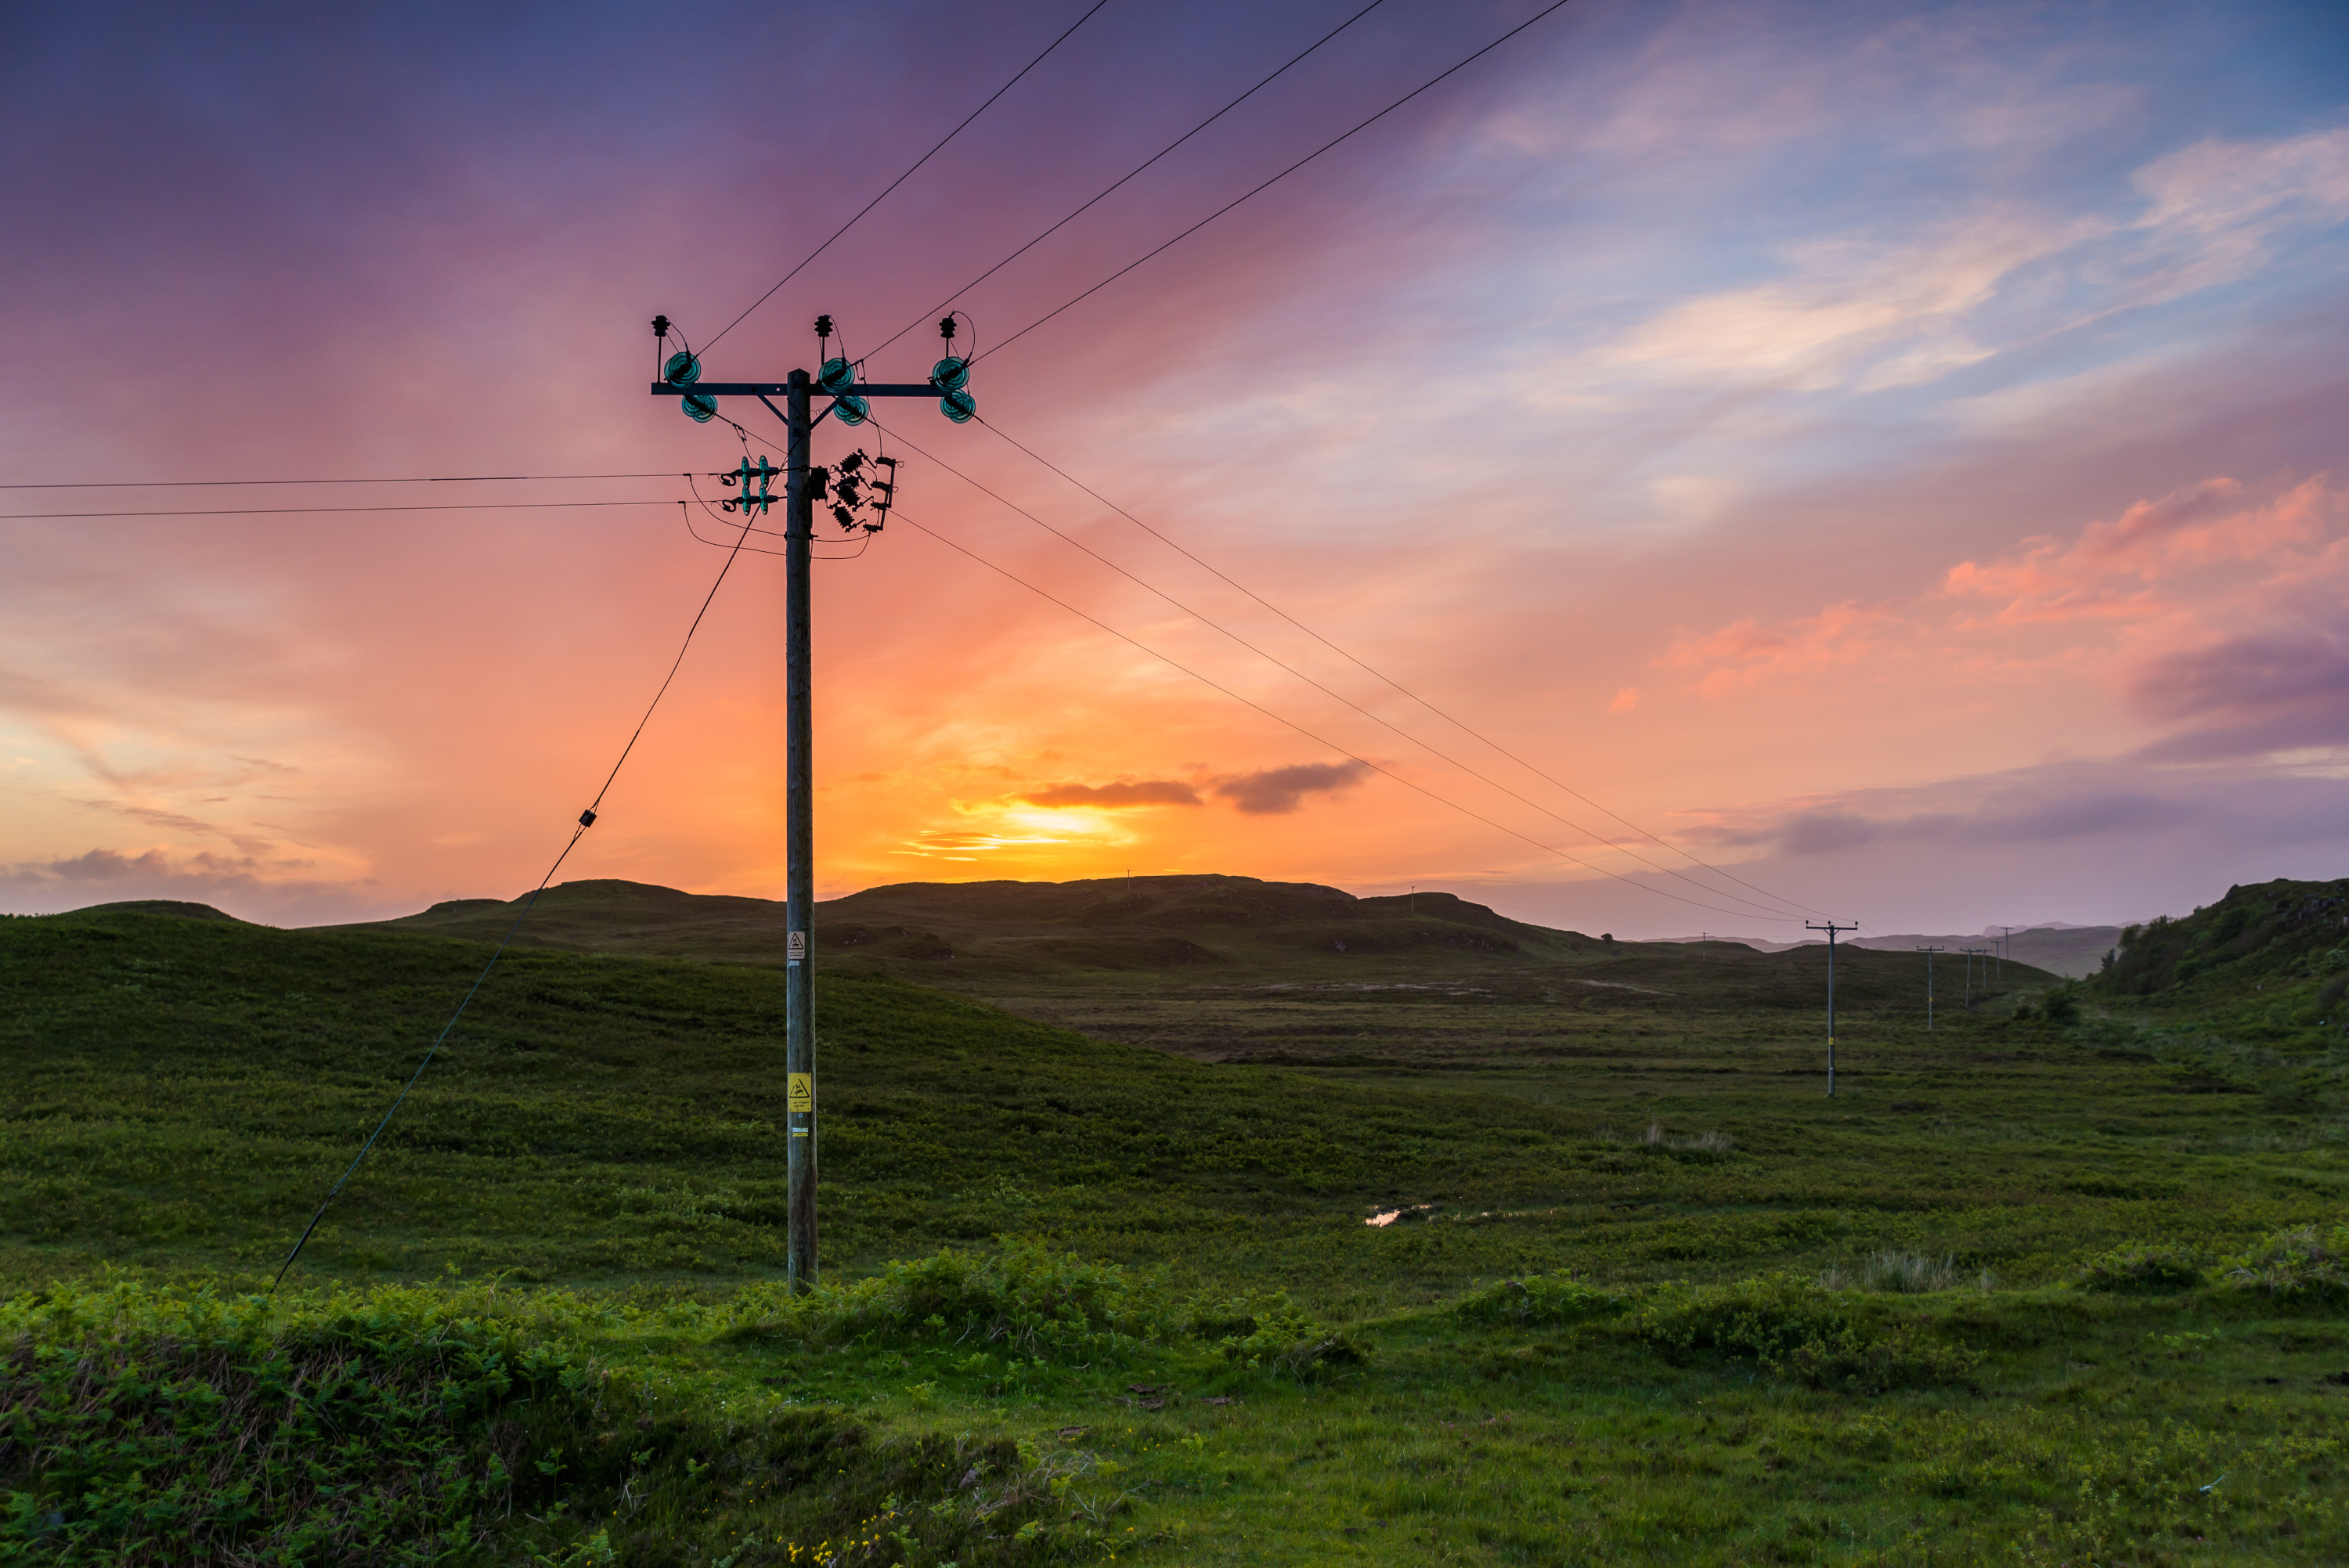
| 04:34, 25 May 2021 | P200D Title Page Image.jpg (file) |  |
1.77 MB | 1 | |
| 14:35, 24 May 2021 | Fire Safety Supplemental.PNG (file) |  |
193 KB | 1 | |
| 11:10, 10 March 2021 | EPRI logo 2015 RGB.png (file) | 293 KB | 1 | ||
| 16:36, 25 February 2021 | JoeThompson.jpg (file) |  |
6 KB | 1 | |
| 12:00, 24 September 2020 | Tools.png (file) |  |
2 KB | 1 | |
| 11:54, 24 September 2020 | Standards.png (file) |  |
2 KB | 1 | |
| 11:53, 24 September 2020 | Roadmap.png (file) |  |
2 KB | 1 | |
| 11:48, 24 September 2020 | Practices.png (file) |  |
2 KB | 1 | |
| 11:48, 24 September 2020 | Metrics.png (file) |  |
2 KB | 1 | |
| 11:47, 24 September 2020 | EmergingResources.png (file) |  |
2 KB | 1 | |
| 11:46, 24 September 2020 | AssessmentMethods.png (file) |  |
1 KB | 1 | |
| 10:18, 24 September 2020 | RA Overview.jpg (file) |  |
75 KB | 1 | |
| 10:19, 24 August 2020 | DP MAIN.png (file) |  |
7 KB | 1 | |
| 10:19, 24 August 2020 | FA MAIN.png (file) |  |
5 KB | 1 | |
| 10:18, 24 August 2020 | RA MAIN.png (file) |  |
6 KB | 1 | |
| 11:07, 20 August 2020 | Faimage33.png (file) |  |
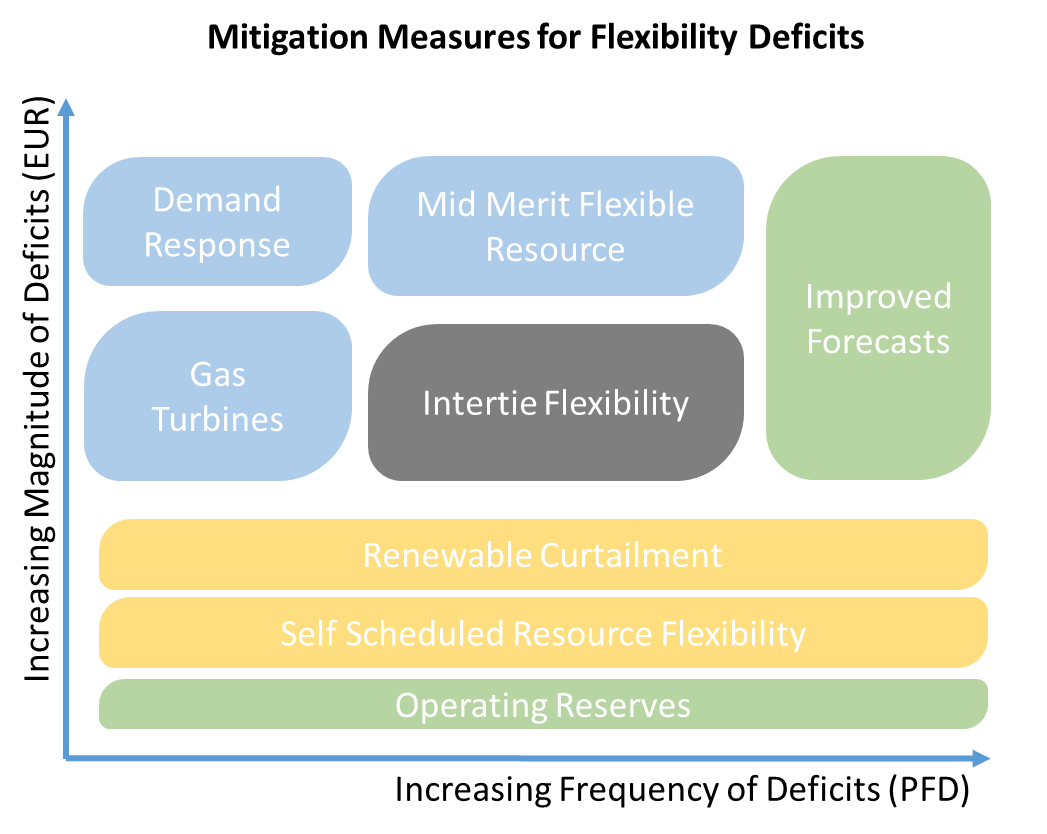
89 KB | Mitigation Measures that can be Considered | 1 |
| 10:09, 20 August 2020 | Faimage32.png (file) |  |
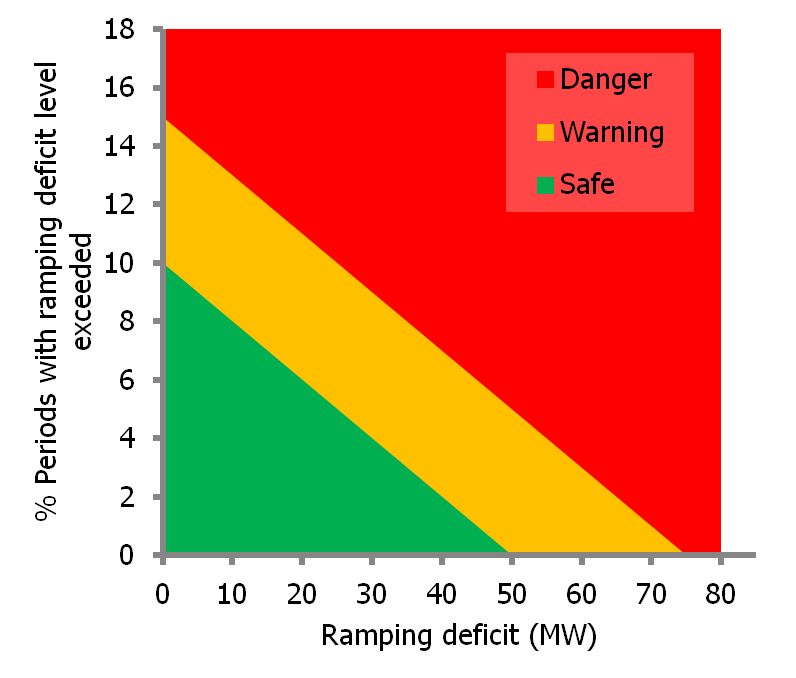
36 KB | Example of well-being analysis display in InFLEXion | 1 |
| 10:07, 20 August 2020 | Faimage34.png (file) |  |
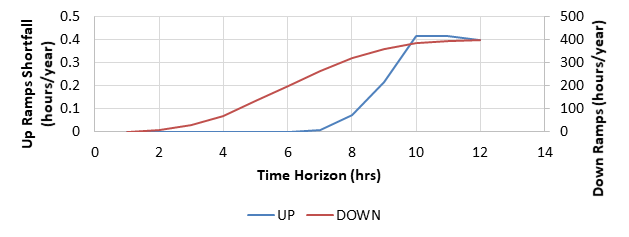
16 KB | Example of Periods of Flexibility Deficit Results (Upwards on Left Axis, Downward on Right) | 1 |
| 10:05, 20 August 2020 | Faimage31.png (file) |  |
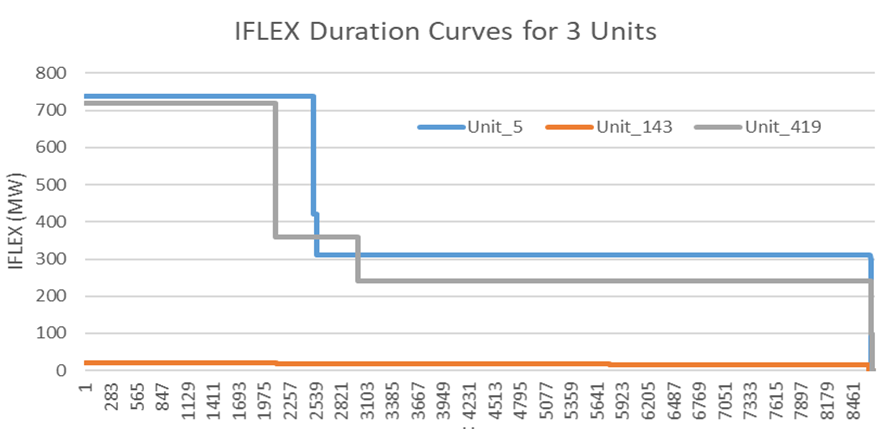
54 KB | IFLEX duration curves for the three selected units | 1 |
| 10:04, 20 August 2020 | Faimage30.png (file) |  |
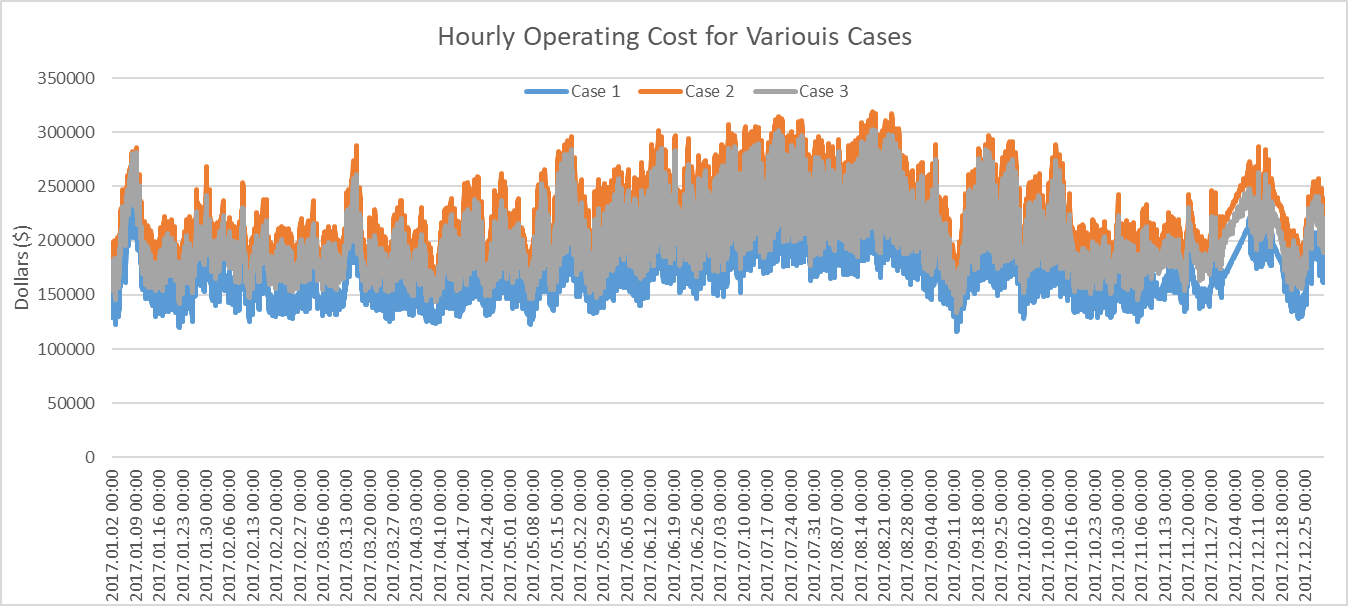
85 KB | Hourly operation cost curves for various cases | 1 |
| 10:03, 20 August 2020 | Faimage29.png (file) |  |
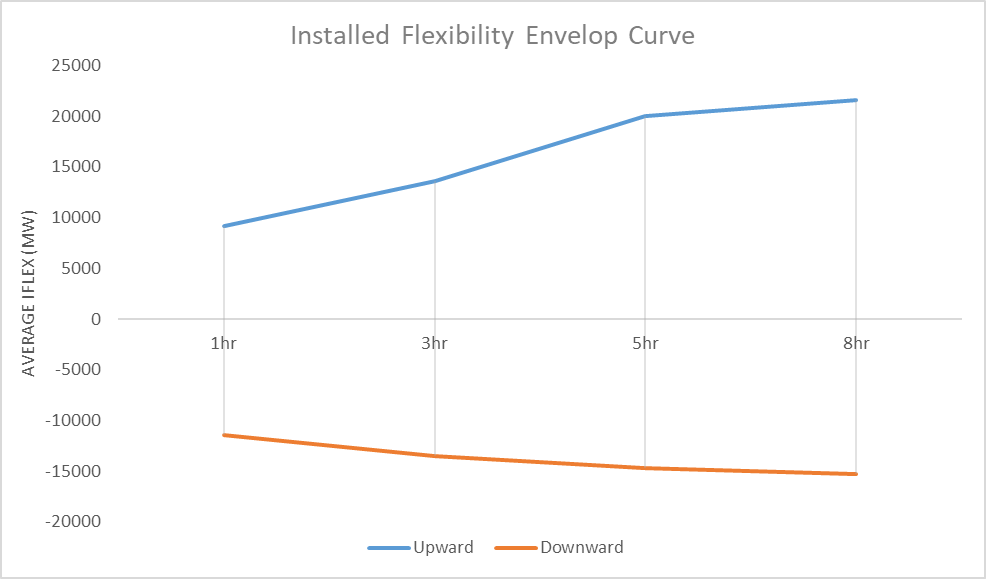
15 KB | Average Installed Flexibility Envelop Curves for the Studied System | 1 |
| 10:02, 20 August 2020 | Faimage28.png (file) |  |
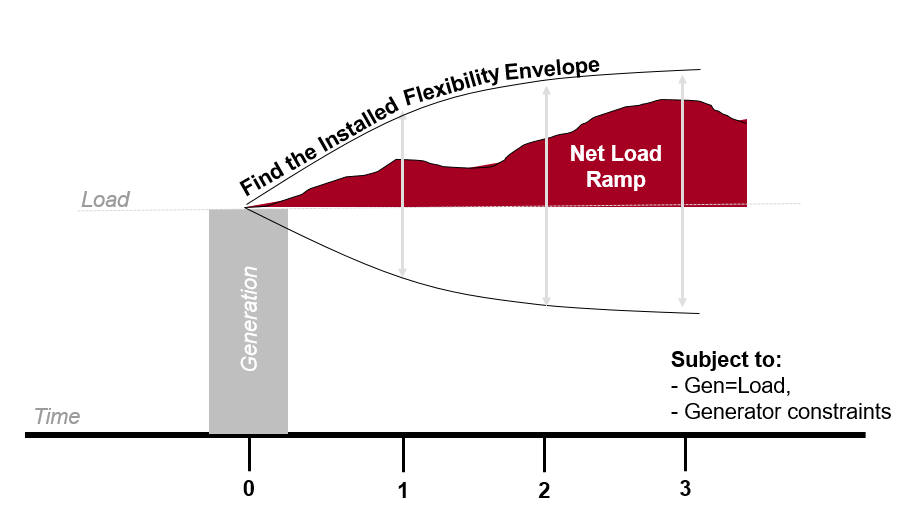
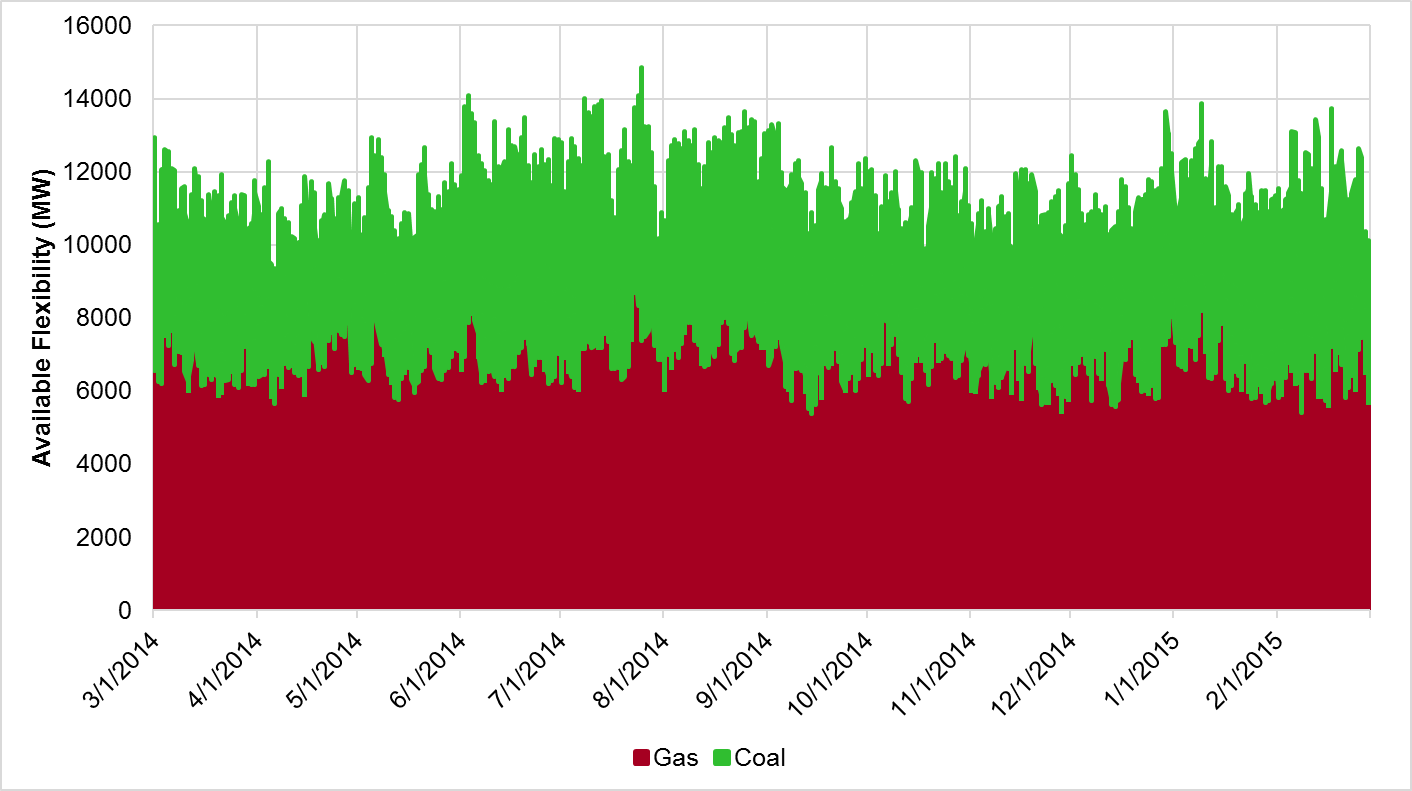
39 KB | Installed Flexibility Envelop | 1 |
| 10:00, 20 August 2020 | Faimage27.png (file) |  |
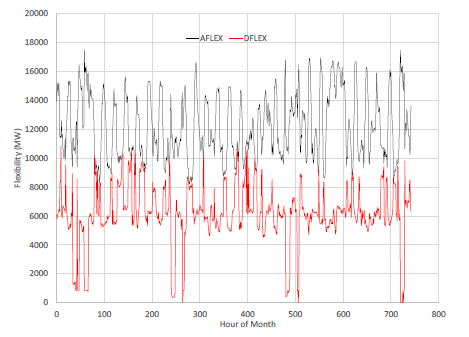
32 KB | Comparison of AFLEX and DFLEX at the 60-min horizon for one month from 2016 EPRI report [15] | 1 |
| 09:59, 20 August 2020 | Faimage26.png (file) |  |
58 KB | Example of Available one-hour Upwards Flexibility | 1 |
| 09:55, 20 August 2020 | Faimage16.png (file) |  |
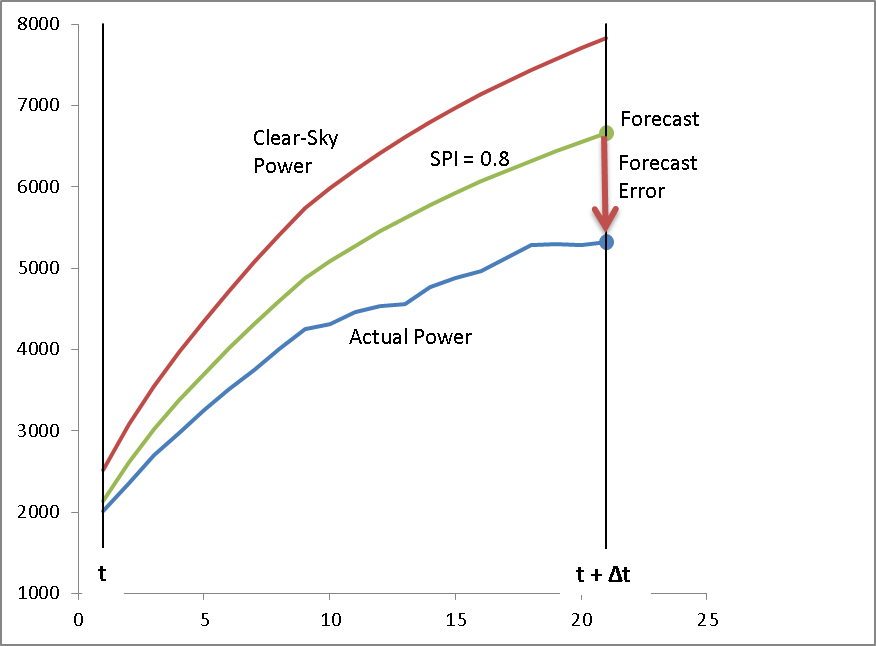
38 KB | Concept of Clear Sky power, Solar Power Index (SPI) and Variability of Solar | 1 |
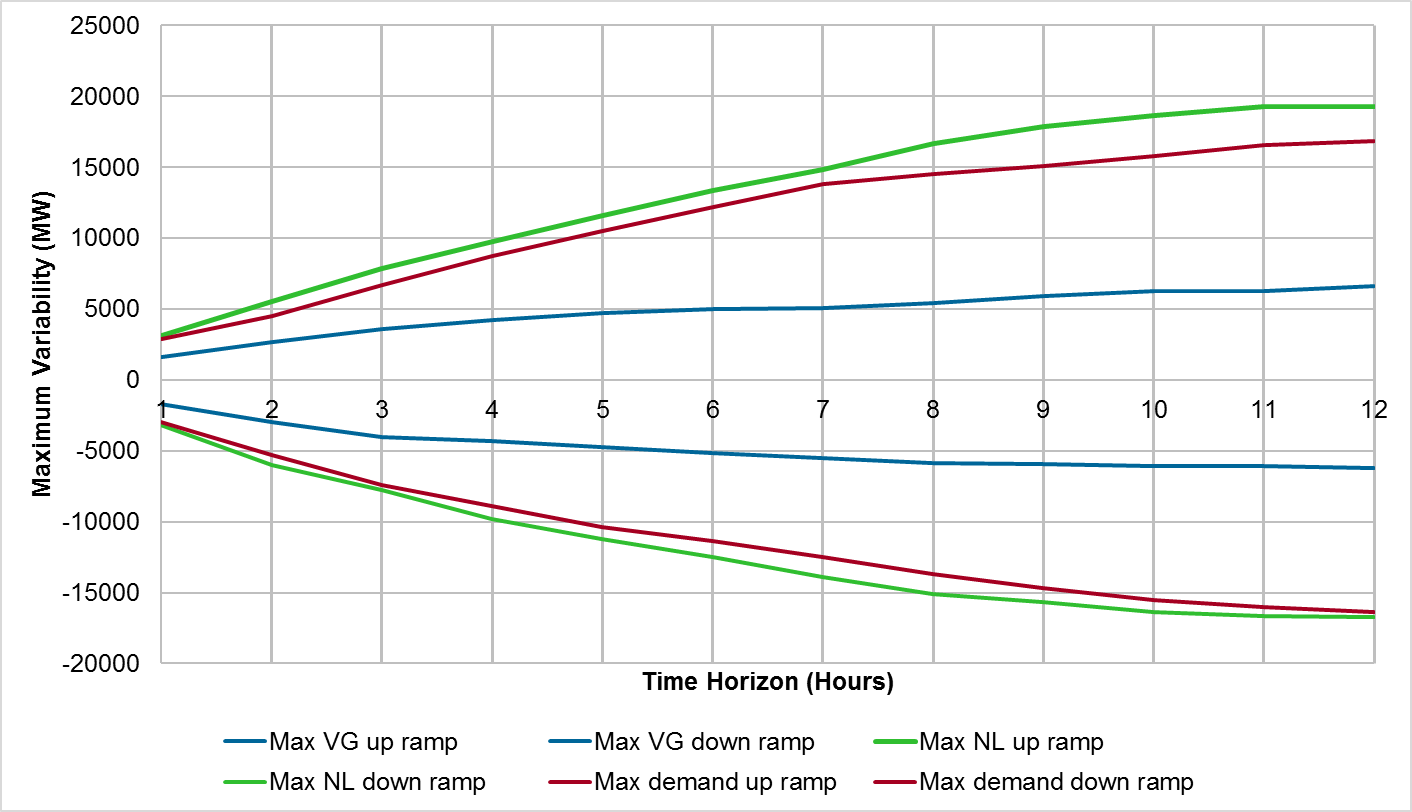
| 09:53, 20 August 2020 | Faimage15.png (file) |  |
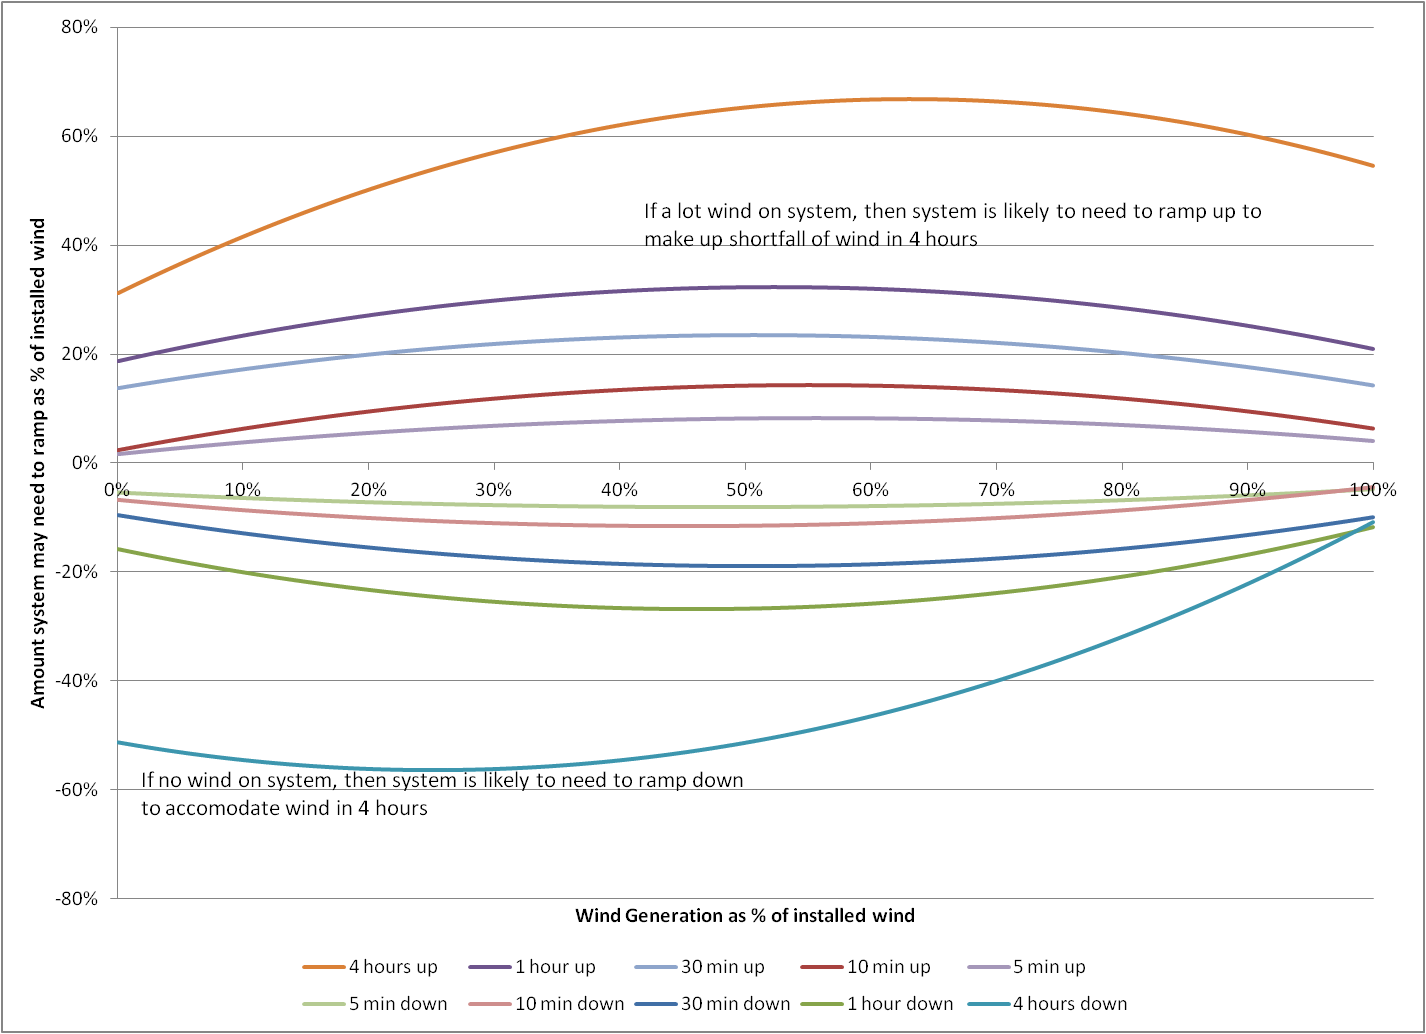
96 KB | Example of potential needs for Flexibility to manage Wind Power Ramping over different horizons | 1 |
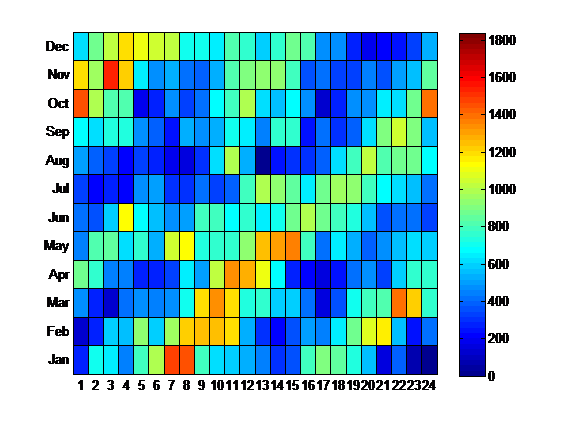
| 09:50, 20 August 2020 | Image14.png (file) |  |
42 KB | Maximum 1-hour Net Load Variability by Time of Day and Month of Year, in MW | 1 |
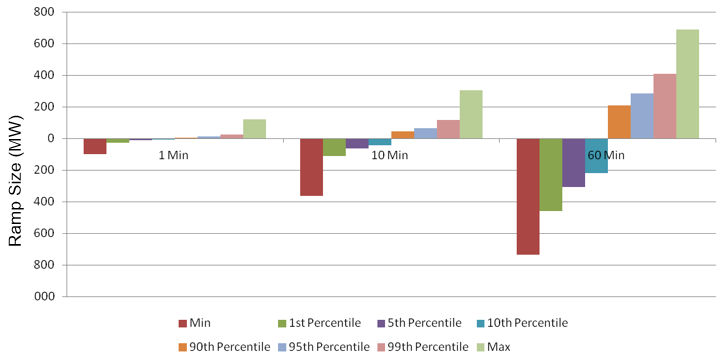
| 09:45, 20 August 2020 | Faimage13.png (file) |  |
27 KB | Maximum Variability by Time Interval For Various Percentiles | 1 |
| 09:43, 20 August 2020 | Faimage12.png (file) |  |
85 KB | Example of Ramping Versus Time Horizon | 1 |
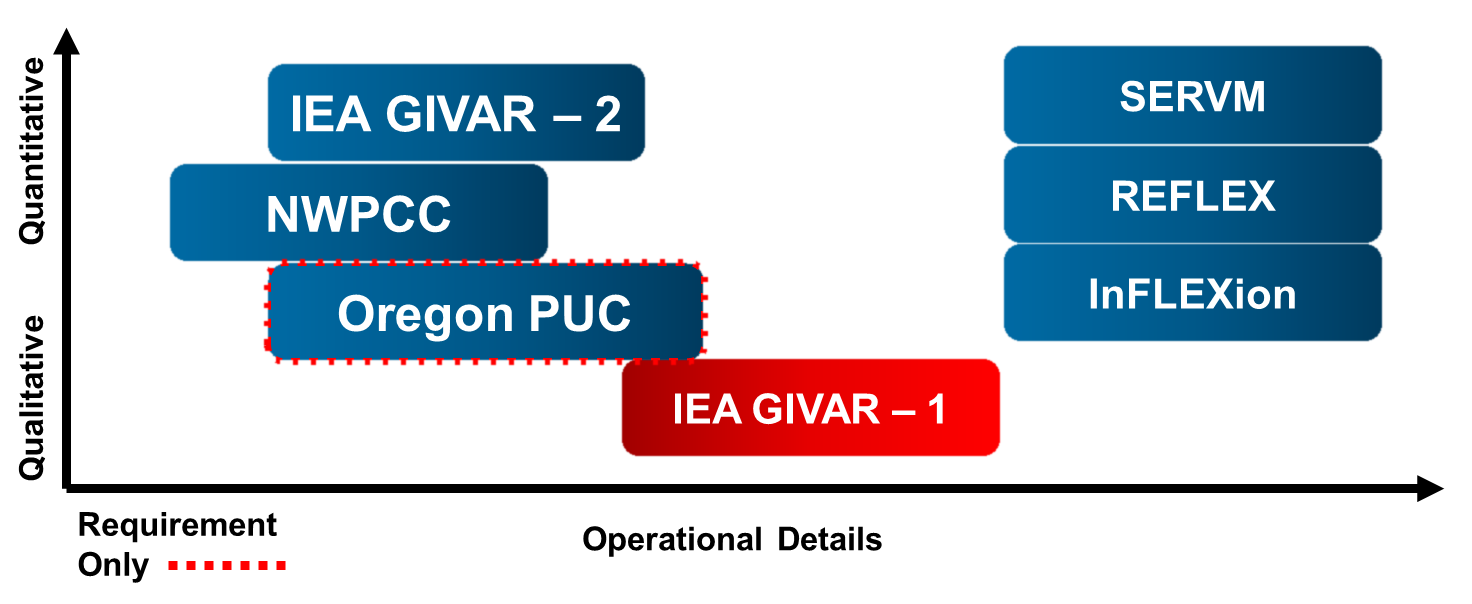
| 09:14, 20 August 2020 | Faimage11.png (file) |  |
97 KB | Different Methods used as described in this report, showing level of detail and type of analysis | 1 |
| 09:12, 20 August 2020 | Faimage10.png (file) |  |
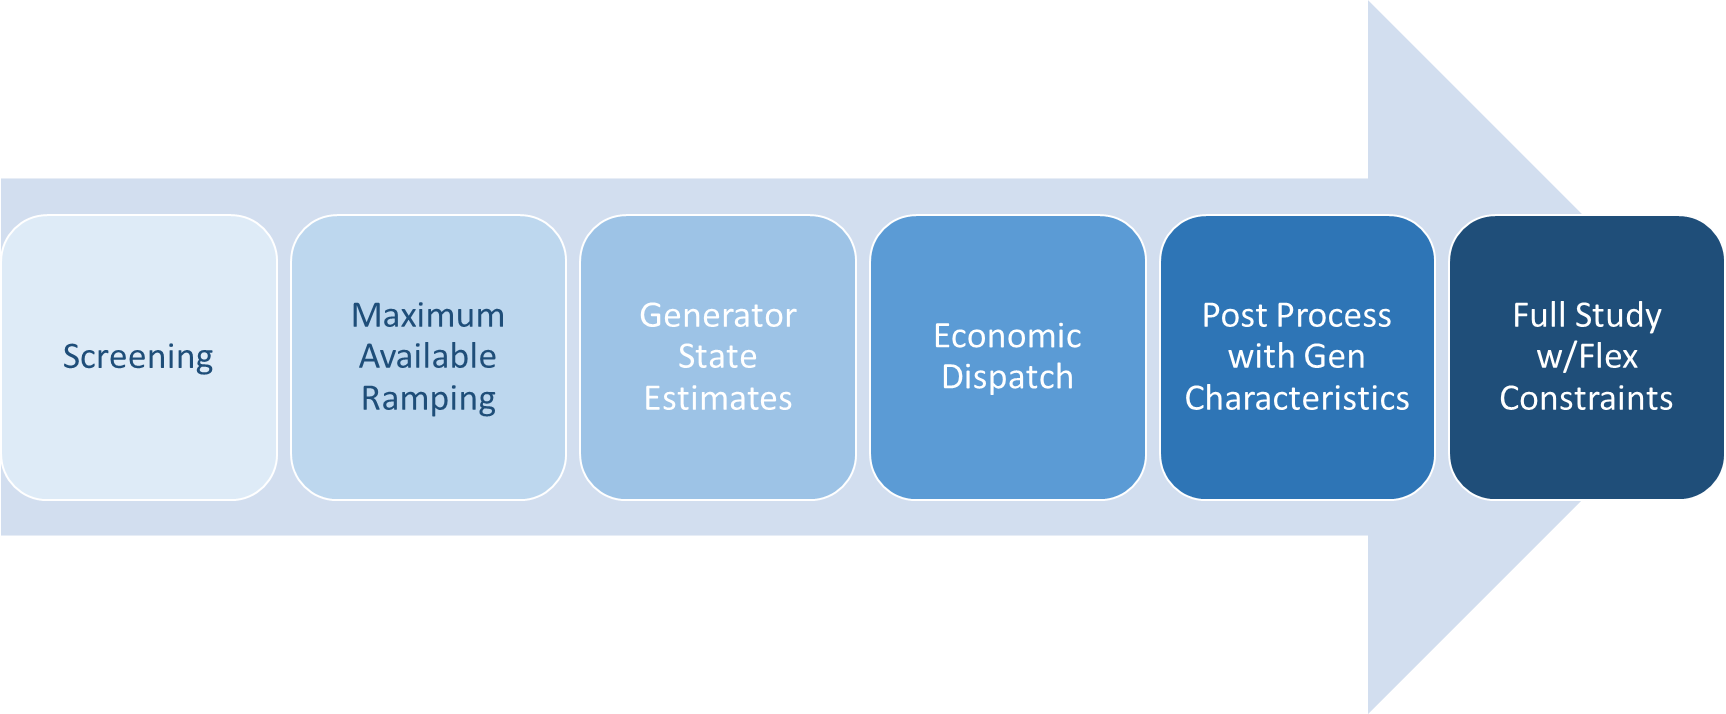
77 KB | Evolution of Methods Used from Simple Screening to Detailed Analysis | 1 |
| 09:10, 20 August 2020 | Faimage9.png (file) |  |
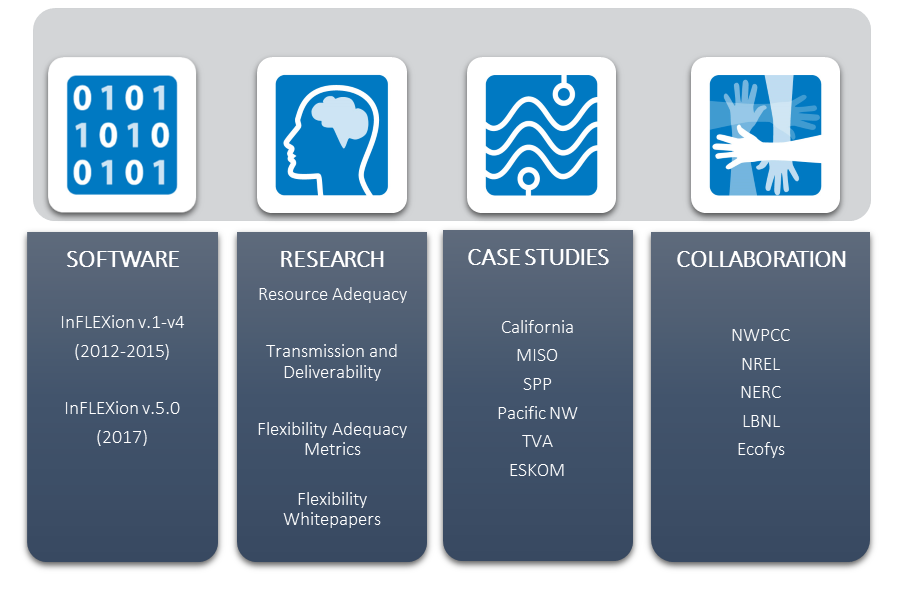
124 KB | EPRI work to date on Flexibility Studies | 1 |
| 09:55, 19 August 2020 | Faimage8.png (file) |  |
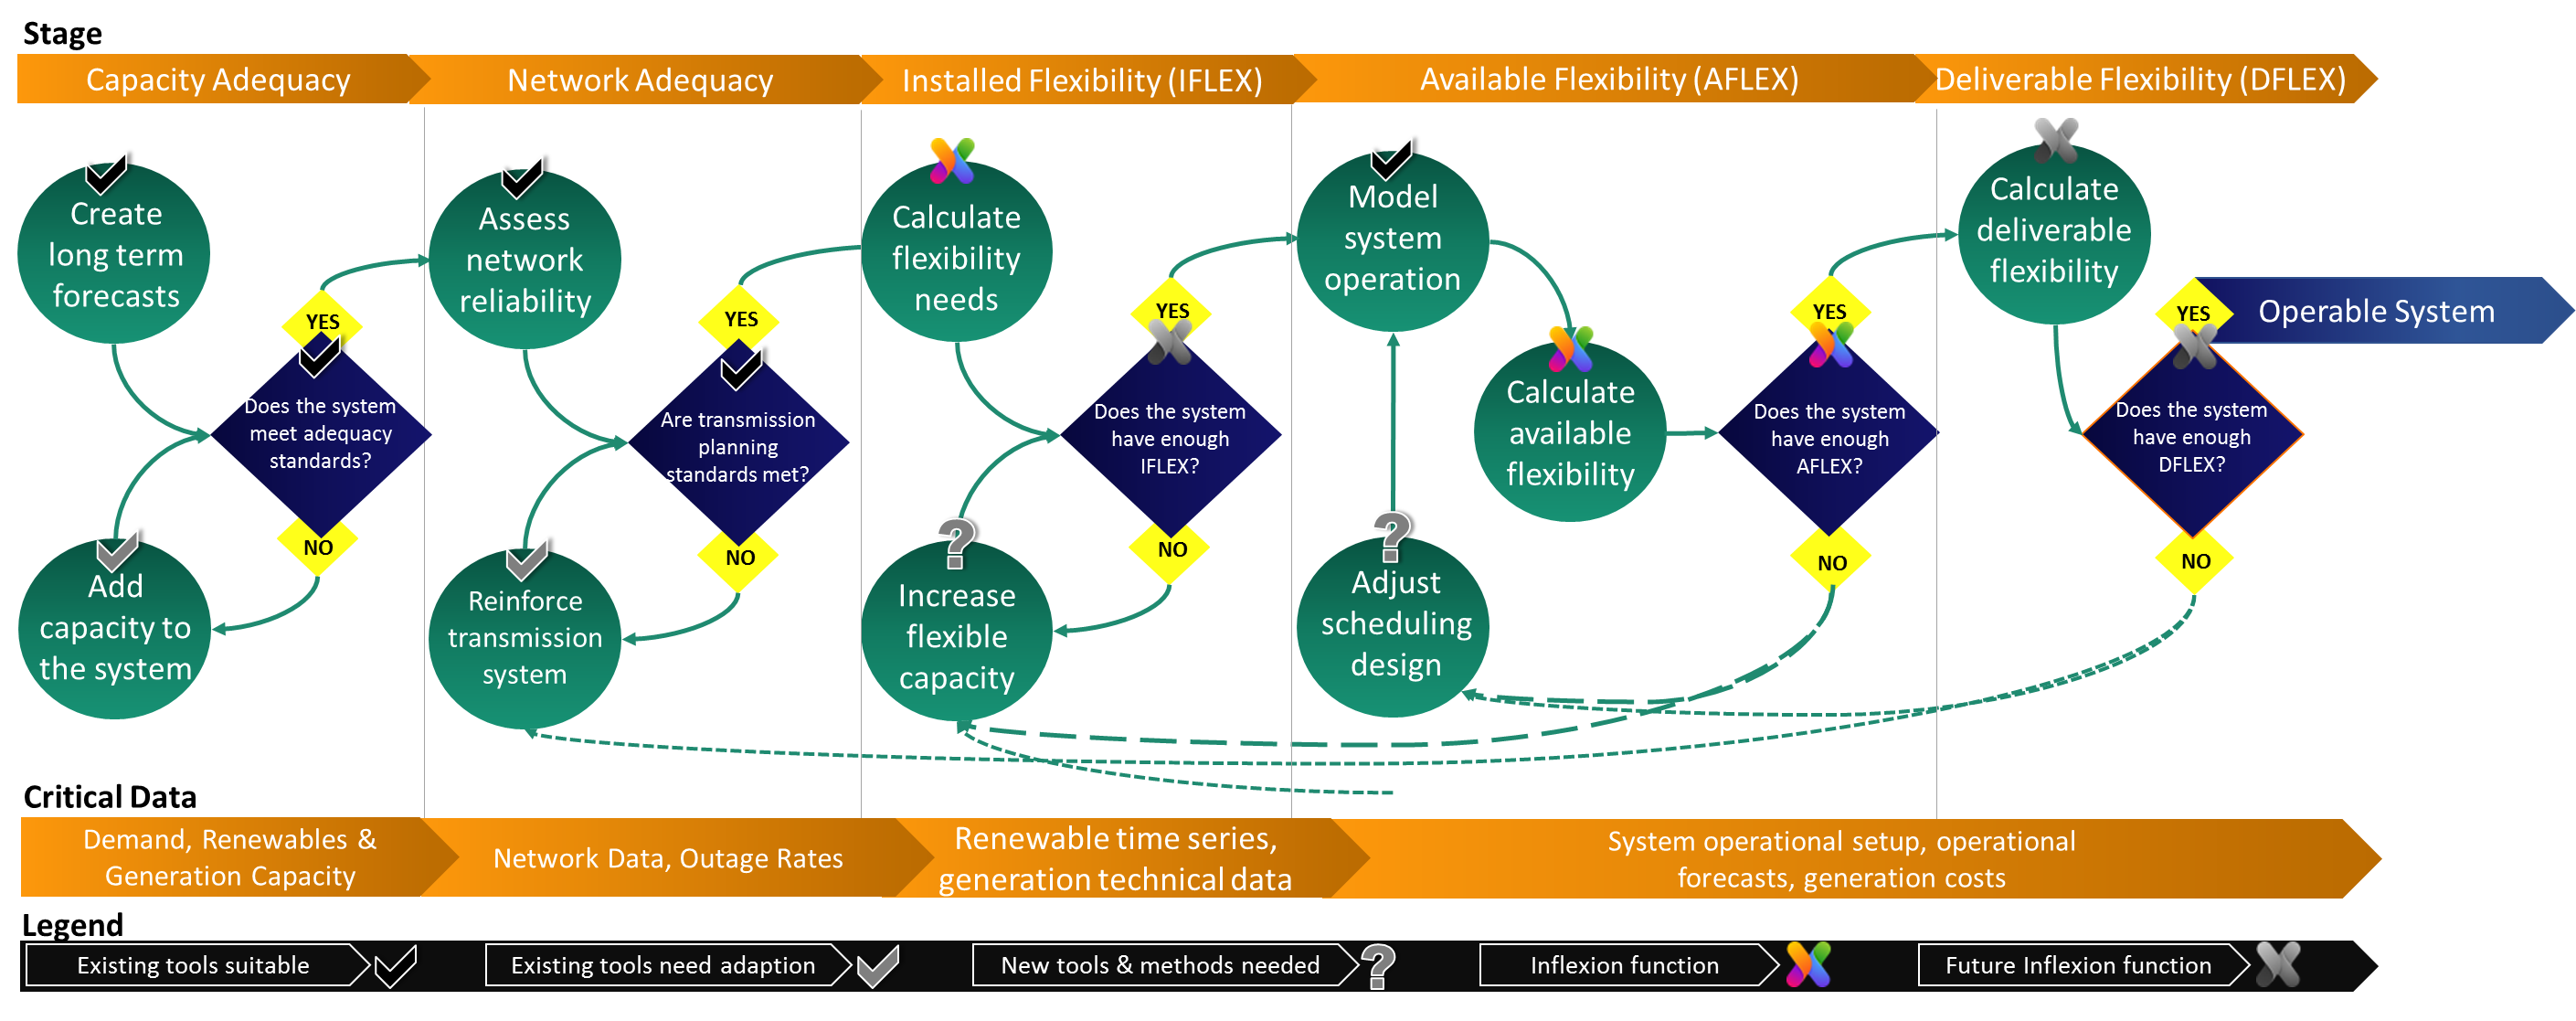
554 KB | Flow chart for flexibility in existing and new planning processes | 1 |
| 09:53, 19 August 2020 | Faimage7.png (file) |  |
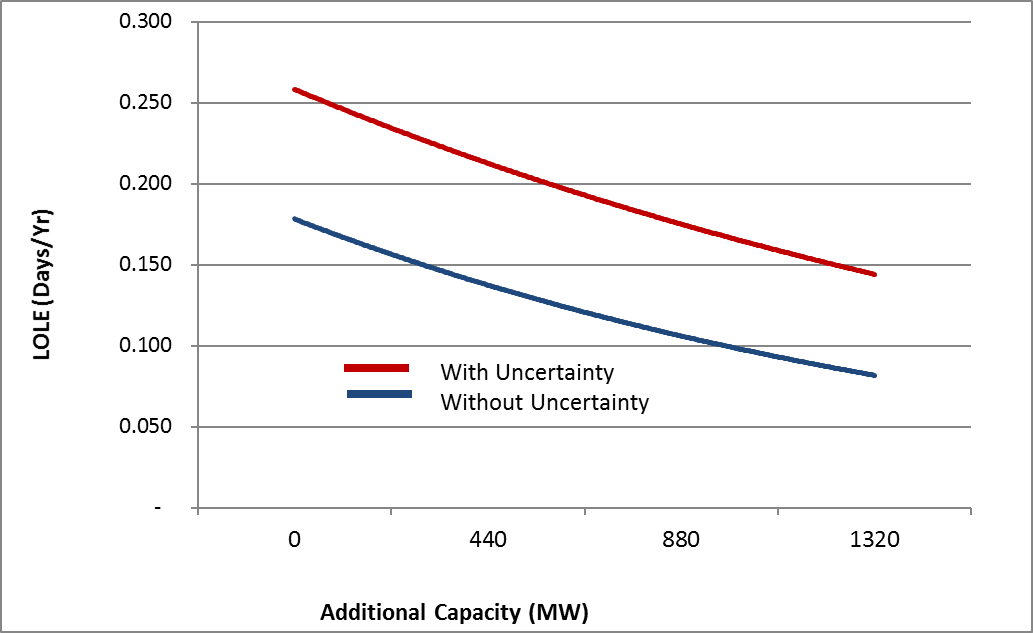
18 KB | Impact of uncertainty on resource adequacy, from previous EPRI work [11] | 1 |
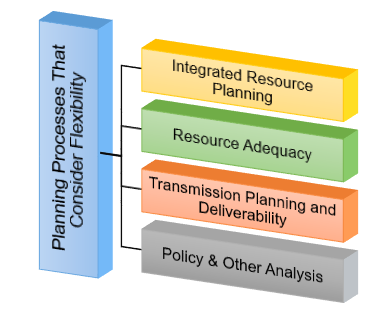
| 09:29, 19 August 2020 | Faimage6.png (file) |  |
53 KB | Planning Processes That Consider Flexibility | 1 |
| 09:19, 19 August 2020 | Faimage5.png (file) |  |
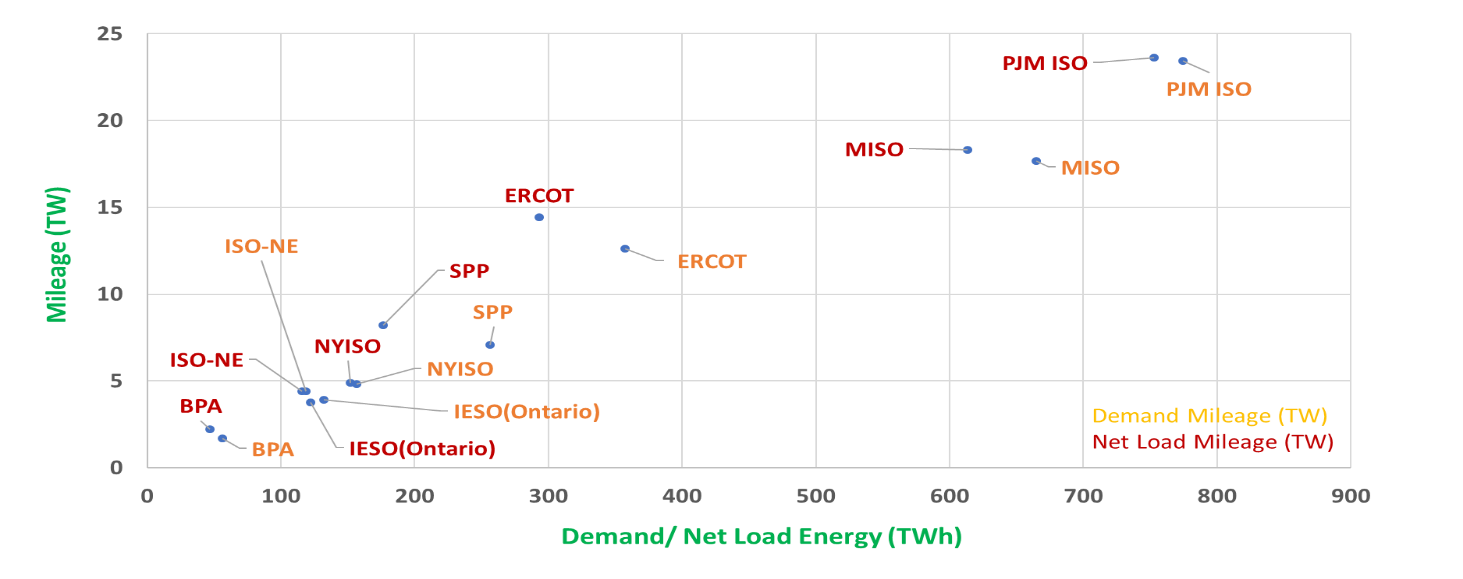
90 KB | Ramping Mileage for Selected Balancing Areas in the US for Demand Only and Net Load | 1 |
| 09:17, 19 August 2020 | FaImage5.png (file) |  |
90 KB | Ramping Mileage for Selected Balancing Areas in the US for Demand Only and Net Load | 1 |
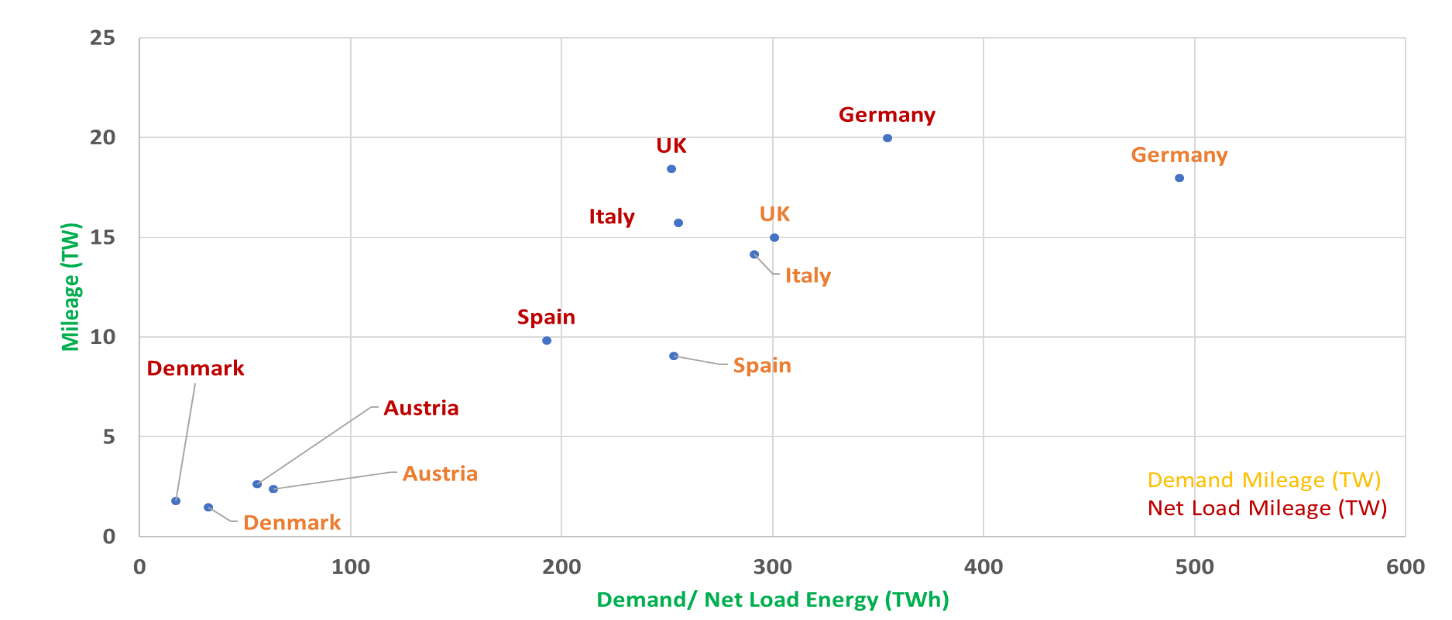
| 09:15, 19 August 2020 | Faimage4.png (file) |  |
74 KB | Ramping Mileage for Selected Balancing Areas in Europe for Demand Only and Net Load | 1 |
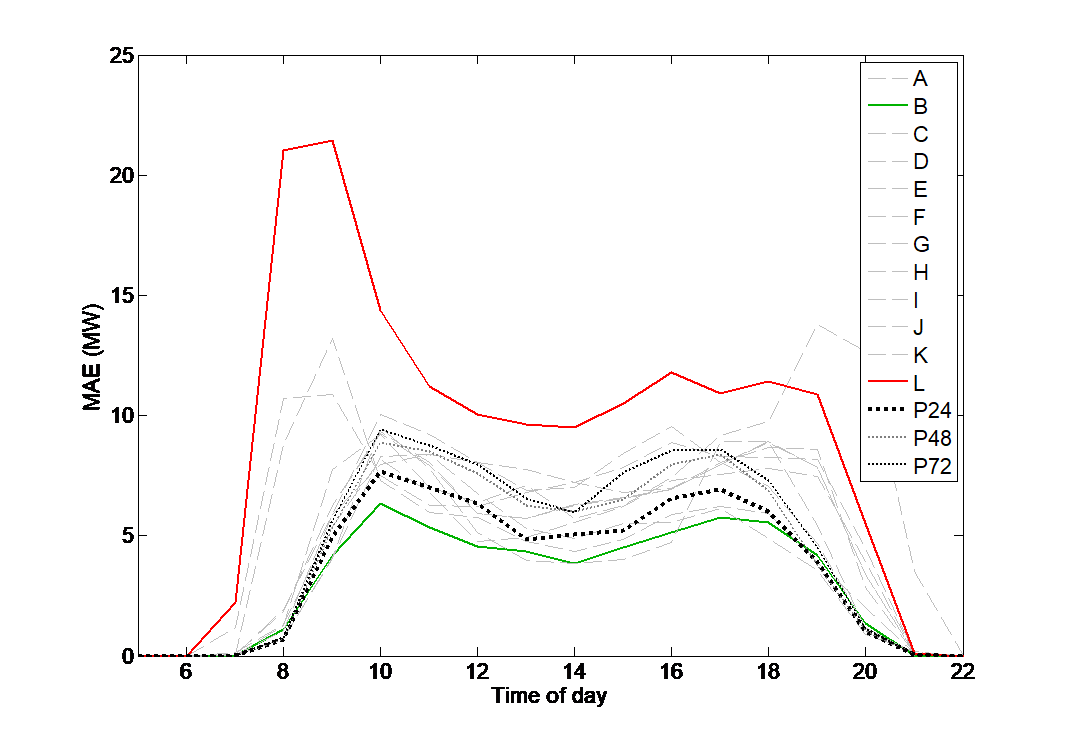
| 09:13, 19 August 2020 | Faimage3.png (file) |  |
38 KB | Uncertainty in Solar Power Output for a Plant in Texas, based on different solar forecasts | 1 |
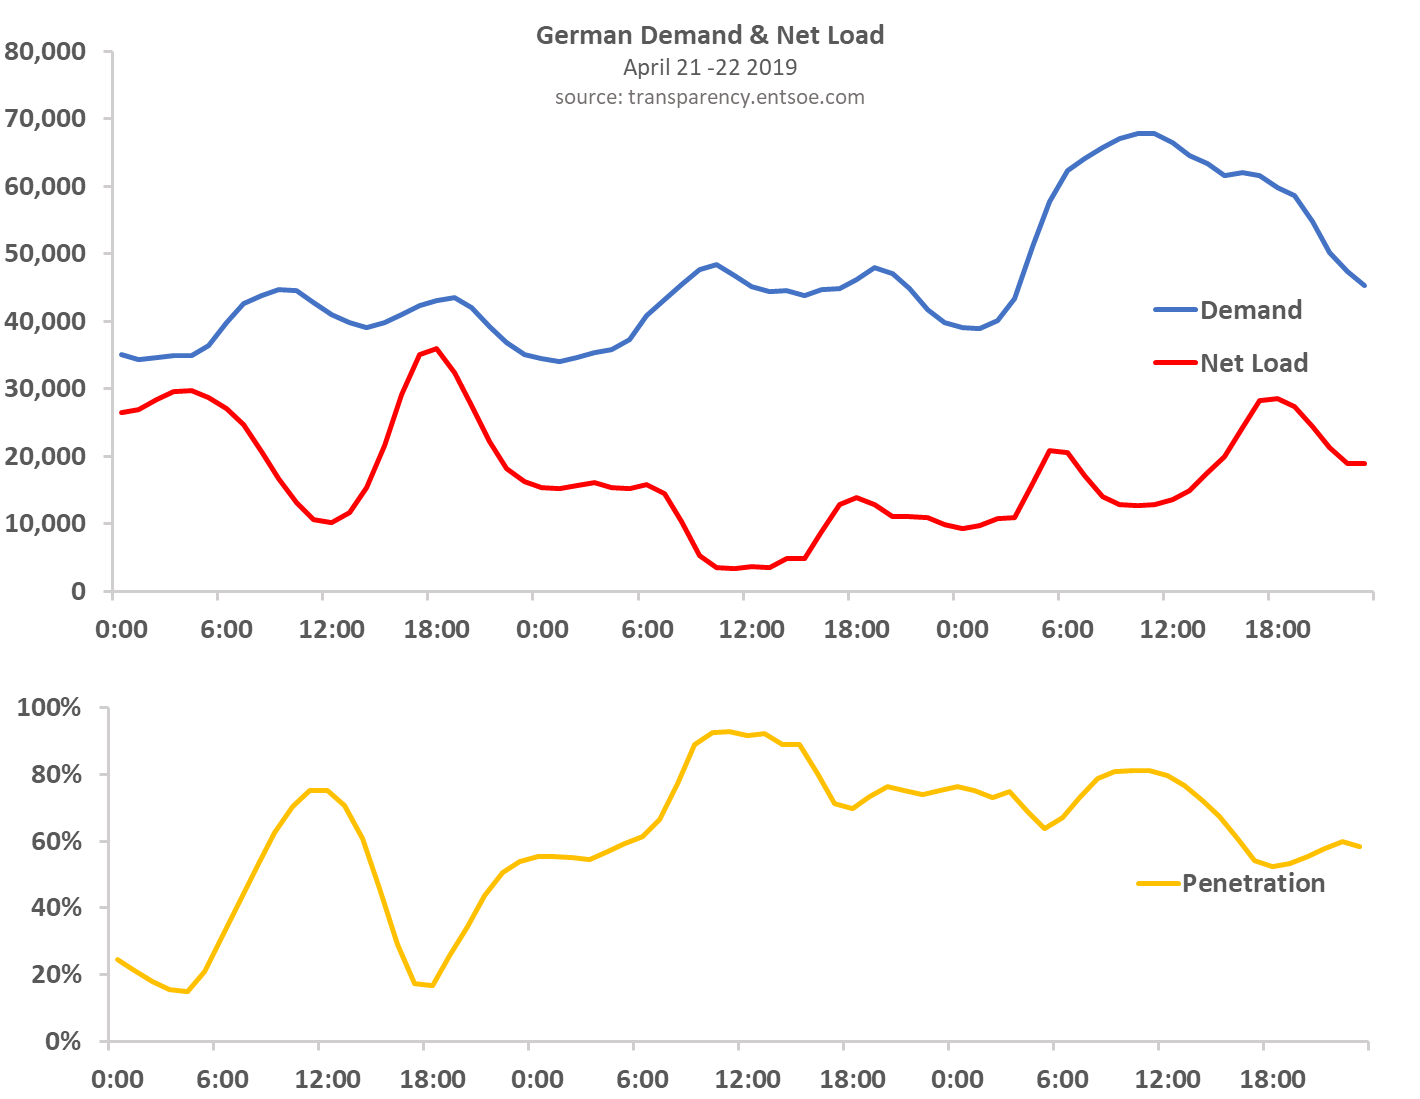
| 09:09, 19 August 2020 | Image2.png (file) |  |
38 KB | Variability of Wind and Solar Power in Germany over 3-day period | 1 |
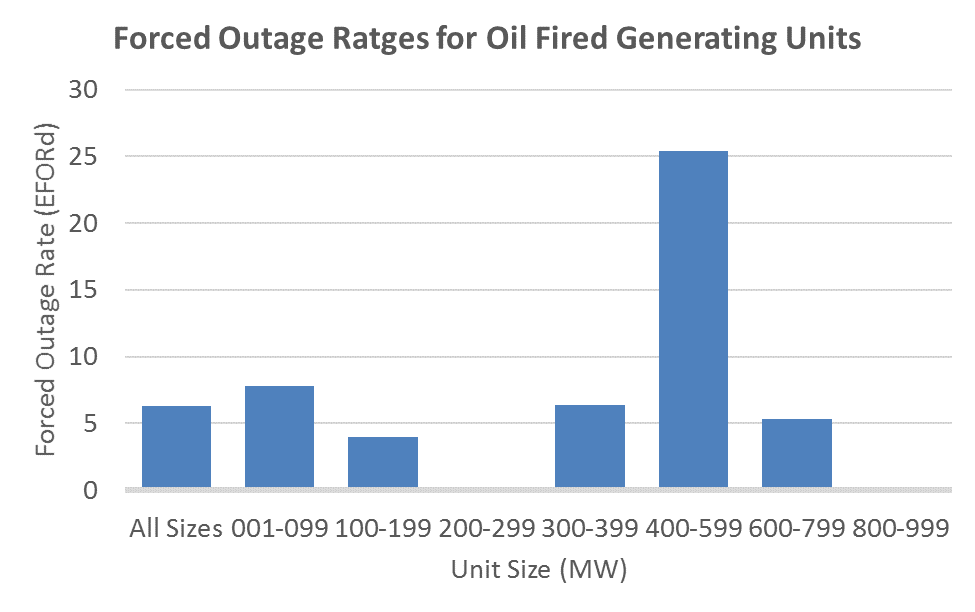
| 16:41, 18 August 2020 | Image13.png (file) |  |
18 KB | Conventional units may not be available during peak periods | 1 |
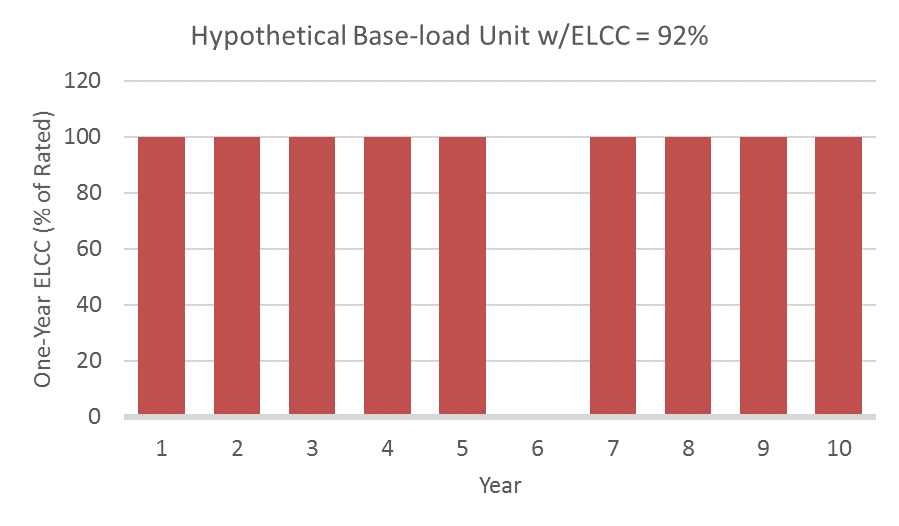
| 16:38, 18 August 2020 | Image12.png (file) |  |
16 KB | Example of generic thermal ELCC vs. UCAP | 1 |
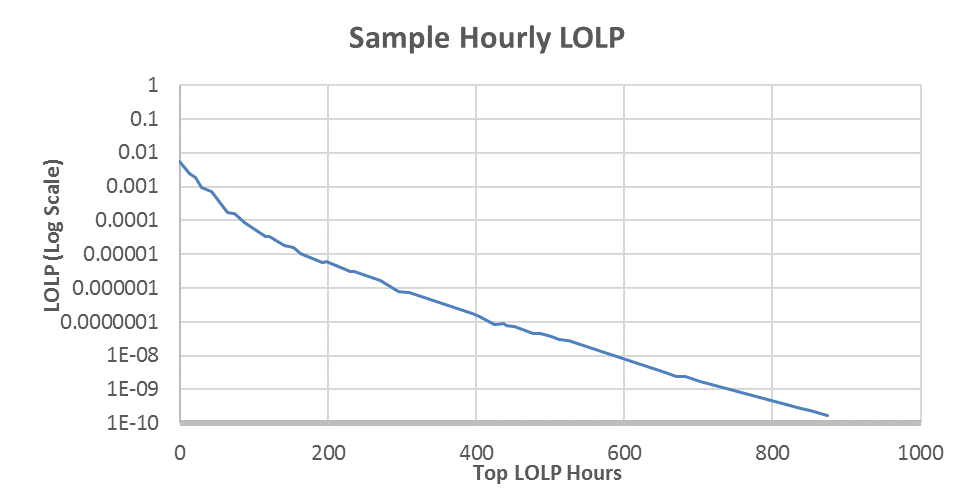
| 16:34, 18 August 2020 | Image11.png (file) |  |
14 KB | Most hours of the year have no risk as measured by LOLP Data | 1 |
| 16:31, 18 August 2020 | Image10.png (file) |  |
99 KB | Effective Load-Carrying Capability | 1 |