EPRI ADMIN (talk | contribs) |
EPRI ADMIN (talk | contribs) |
||
| Line 38: | Line 38: | ||
=== Deliverable Flexibility (DFLEX) === | === Deliverable Flexibility (DFLEX) === | ||
| − | Deliverable flexibility (DFLEX), developed by EPRI in 2015-2016 and planned to be implemented in an upcoming version of the InFLEXion tool. This concept takes into account that when the transmission network is considered, not all flexibility may be able to be deliverable. Constraints, under normal or contingency condition, may reduce the amount of power that can flow and thus also reduce the amount of flexibility that may be delivered. EPRI has developed a number of methods, from simple to detailed, to assess the reduction in flexibility that is seen when the network and the sources and sinks of flexibility are included in the calculation. More details on DFLEX are provided in the 2015 and 2016 reports ( | + | Deliverable flexibility (DFLEX), developed by EPRI in 2015-2016 and planned to be implemented in an upcoming version of the InFLEXion tool. This concept takes into account that when the transmission network is considered, not all flexibility may be able to be deliverable. Constraints, under normal or contingency condition, may reduce the amount of power that can flow and thus also reduce the amount of flexibility that may be delivered. EPRI has developed a number of methods, from simple to detailed, to assess the reduction in flexibility that is seen when the network and the sources and sinks of flexibility are included in the calculation. More details on DFLEX are provided in the 2015 and 2016 reports (<ref name="F14"></ref> and <ref>Strategic and Flexible System Planning – 2016 Update: Deliverable Flexibility and Flexibility in Resource Adequacy. EPRI, Palo Alto, CA: 2016. 3002008379.</ref>), but a short description is provided below of the methods to be used. |
Based on case studies carried out in the past several years, two methods are proposed to calculate DFLEX when analyzing system flexibility. Both were compared against both AFLEX to understand how they may impact on flexibility shortfalls. | Based on case studies carried out in the past several years, two methods are proposed to calculate DFLEX when analyzing system flexibility. Both were compared against both AFLEX to understand how they may impact on flexibility shortfalls. | ||
| Line 47: | Line 47: | ||
2015 studies showed results for both methods, as well as a simpler method. In 2016, EPRI continued improvements on both methods, but determine that the maximum OPF method, while taking somewhat longer, can be sped up such that its higher accuracy results in it being the most desirable method to use in the studies of DFLEX. As such, this is what is being implemented in InFLEXion. | 2015 studies showed results for both methods, as well as a simpler method. In 2016, EPRI continued improvements on both methods, but determine that the maximum OPF method, while taking somewhat longer, can be sped up such that its higher accuracy results in it being the most desirable method to use in the studies of DFLEX. As such, this is what is being implemented in InFLEXion. | ||
| − | [[File:faimage27.png|center|border|frame|Figure ‑ Comparison of AFLEX and DFLEX at the 60-min horizon for one month from 2016 EPRI report | + | [[File:faimage27.png|center|border|frame|Figure ‑ Comparison of AFLEX and DFLEX at the 60-min horizon for one month from 2016 EPRI report <ref name="F15"></ref>]] |
While more details on the method can be found there, it is instructive to illustrate how this calculation may impact on results. As shown in Figure 5‑2, DFLEX is significantly less than AFLEX for this particular system; note that other systems may not see as severe a difference, but in general, it would be expected that transmission constraints do limit flexibility. Depending on the type of study being performed (e.g. how far in the future it is set, whether it is assessing both transmission and resource needs, and whether it the data is available for DFLEX), this method therefore can produce significantly more detail than the AFLEX or NFLEX calculations described above. While not yet standard in various flexibility studies being carried out, once the methods are better tested (through ongoing case studies by EPRI), these methods can also be employed in flexibility assessment. In 2018, DFLEX is being added to the next version of Inflexion, to be released in early 2019. | While more details on the method can be found there, it is instructive to illustrate how this calculation may impact on results. As shown in Figure 5‑2, DFLEX is significantly less than AFLEX for this particular system; note that other systems may not see as severe a difference, but in general, it would be expected that transmission constraints do limit flexibility. Depending on the type of study being performed (e.g. how far in the future it is set, whether it is assessing both transmission and resource needs, and whether it the data is available for DFLEX), this method therefore can produce significantly more detail than the AFLEX or NFLEX calculations described above. While not yet standard in various flexibility studies being carried out, once the methods are better tested (through ongoing case studies by EPRI), these methods can also be employed in flexibility assessment. In 2018, DFLEX is being added to the next version of Inflexion, to be released in early 2019. | ||
Revision as of 09:40, 15 September 2020
Contents
Flexibility Metrics
Here, we focus mostly on the level 3 analysis in the EPRI method. However, other approaches are also described where relevant. The main aim is to understand how the flexibility requirements covered earlier are met (or were met in the case of historical analysis). This chapter starts by describing how the flexibility is calculated, and then moves to describing methods to determine whether this flexibility is sufficient to meet the requirements. In models such as REFLEX and SERVM, these requirements and the capability to meet them are implicitly included. The Level 3 methods developed by EPRI explicitly calculate the difference between flexibility from system resources and the requirements assumed to come up with a set of metrics using a post processing approach. Post processing refers to the fact that the calculations are based on existing dispatches, either from simulation or historical data, rather than including the flexibility requirements in the study approaches. Either approach still needs to be interpreted, and that is covered in the next chapter.
There are both, strengths and weaknesses of post processing results to determine flexibility available. The explicit post processing method used in the InFLEXion tool is based on the idea that flexibility assessment should be carried out by examining how much flexibility is available based on assumed operating methods, and comparing that to required. As such, it captures the amount of flexibility assumed based in realistic assumptions on system operations. This allows one to determine how altering operations (e.g. by adding a new reserve product) can impact on flexibility; but on the other hand it may underestimate the actual flexibility that may have been available, were flexibility requirements explicitly included in the optimization- InFLEXion analyzes the results from an existing simulation and thus may not capture where flexibility requirements would have changed the commitment or dispatch of the fleet. Clearly, one can go back and rerun the study based on updated requirements to determine how operations may change and thus converge on a solution that recognized the flexibility needs. Post processing can also be performed in more detail, such that one can determine whether there is an operational solution to the explicit flexibility shortfalls.
Implicit methods, such as the SERVM tool or REFLEX tool (the latter of which works with existing production simulation tools), include flexibility needs in the optimization. This has the advantage of being able to see flexibility deficits as shortfalls in load or reserve requirements. However, it also assumed that operational methods fully account for flexibility needs, and as such does not necessarily show how operations should be adjusted. Typically, these methods also do not represent operational details, such as Mixed Integer Programming in Unit Commitment, or detailed representation of operating cycles such as when look ahead decisions are made, or full network representation. As such, there is a trade-off between the ability to model certain aspects of the system and how it is operated, and the ability to include flexibility assessment through the use of long time periods (35 years in SERVM, Monte Carlo assessment in REFLEX).
One potential approach, examined in the previously mentioned CES-21 project, is to use a detailed probabilistic model such as SERVM, together with the post-processing approach in InFLEXion. In that project, SERVM results are post processed using InFLEXion to provide additional details about flexibility available in the dispatch and compare that to requirements. While that is a longer process, the lessons learned from such studies can help understand how future studies could be performed, using a mix of implicit flexibility representation and post processing to determine flexibility shortfalls. Additionally, in the long term, the aim is to work with tool vendors to incorporate the InFLEXion methods into tools, in order to determine flexibility needs as part of the software itself.
Available, Net, Deliverable and Installed Flexibility
Flexibility can be measured in a number of different ways, as described in the flow chart in Chapter 2. This depends both on the data available and the study being carried out. If running a detailed production cost model as described in Chapter 4, then the most natural metric to calculate is the available flexibility (AFLEX). This is calculated based on the dispatch of a resource and the characteristics of the resource. These characteristics are described in the previous chapter, but the general concept is to determine how much up ramping and down ramping is available from each resource in each time horizon of interest. The net flexibility can then be calculated by subtracting the flexibility requirements, as described earlier, from this available flexibility. Deliverable flexibility (DFLEX) may be calculated by considering the impact of the network. Installed flexibility (IFLEX), which is the maximum amount available in each hour, has recently been develop and can provide additional insight as to whether flexibility shortfalls identified through AFLEX are driven by how the system is operated, or due to a shortfall in flexibility no matter the assumed operations in the production simulation model.
Available Flexibility (AFLEX)
AFLEX in the upward direction is calculated based on whether the unit is synchronized (committed) or offline (decommitted but available to startup) state at the point at which flexibility is calculated. The online flexibility is limited by a resource’s ability to ramp upward or the difference between its dispatch point and the maximum stable level, whichever is less). This is a relatively straight forward calculation that holds true for most flexible resources. Exceptions to this may include resources with ramp rates that are not constant, such as multi-stage plant or where additional auxiliary equipment must be brought online in a staged process. However, for most planning purposes this assumption is sufficient. Offline upward flexibility is slightly more complex than the online formulation. In the most basic model, startup constraints must be adhered to. Therefore, upward flexibility from an offline state is greater than zero if start time is less than the time horizon for which flexibility is being calculated, added to any minimum down time constraints that still need to be fulfilled. S startup trajectories can be considered as well and added to the available flexibility, such that if a unit is not able to fully start (subject to meeting minimum down time), then it may be able to provide some flexibility before meeting minimum generation. Users need to determine whether to account for flexibility for units in the process of starting up.
Downward flexibility is only considered to be available when a unit is synchronized. This representation may not be true for units that can consume as well as generate, such as storage or certain demand response devices. InFLEXion can account for these at present, though it still requires further testing and validation. The online flexibility is limited by the dispatch level, the ramp rate of the resource and the minimum generation level of the resource. Downward flexibility calculations can assume a unit can be turned off and thus provide flexibility all the way to zero, but only if it can get online again within a certain time horizon. This time horizon can be set in the InFLEXion tool, as described in the 2015 report [1].
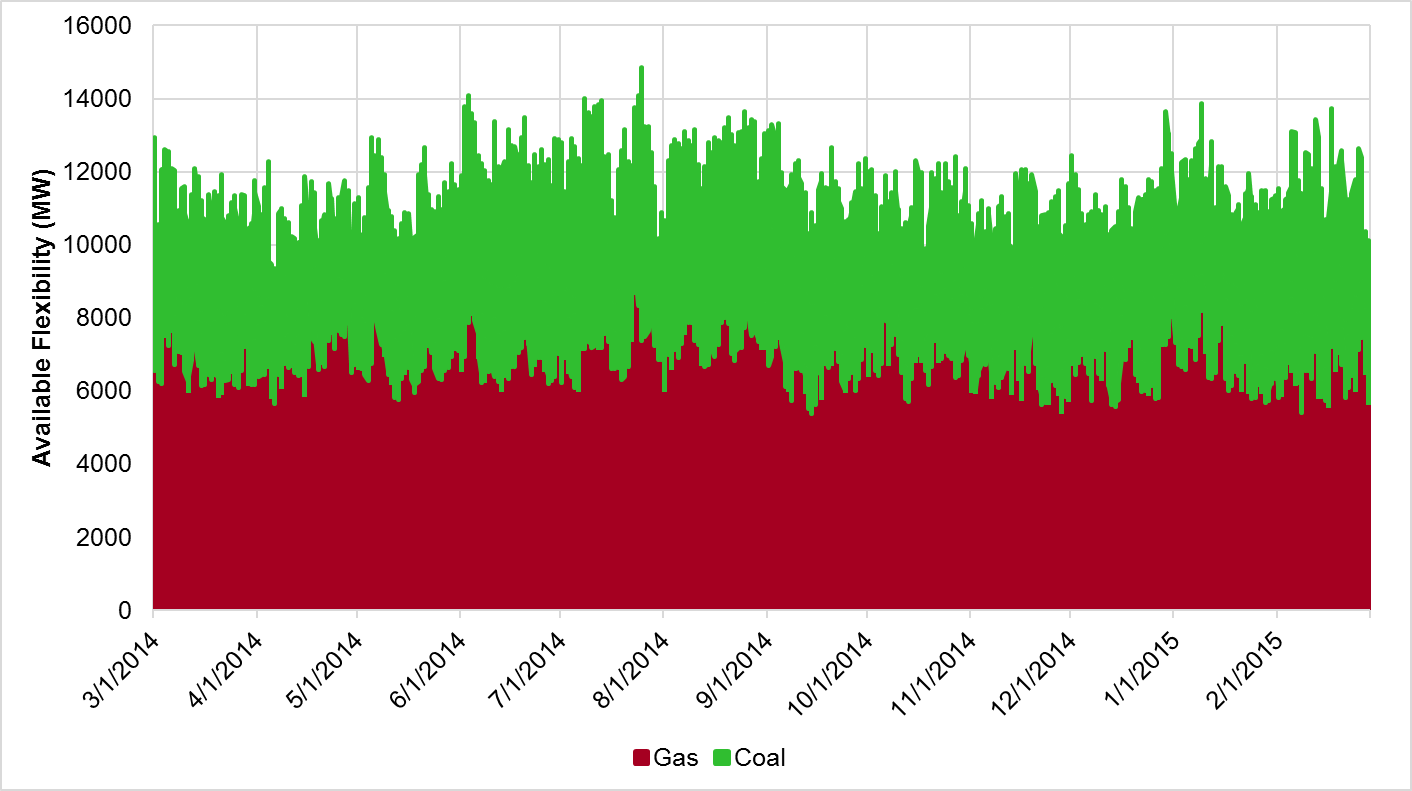
An example of available upwards flexibility is given in Figure 5‑1. This shows, for a study of historical data, how much flexibility is available in each hour of the year from all gas and coal units in a system, as well as the total upwards flexibility. By just looking at this calculation and comparing to requirements, one can often determine relatively quickly whether there is likely to be an issue with flexibility in the system. In the example shown in the figure, if the largest need for flexibility is 5 GW for example, then a study could relatively quickly deduce that flexibility in this time horizon and direction would not be an issue, without needing detailed analysis as proposed in the later sections of this chapter. If flexibility requirements and available are close, however, one would need to calculate the metrics proposed.
Net Flexibility (NFLEX)
Once available flexibility has been calculated, the next step is to determine the net flexibility (NFLEX) available, once actual use of the system flexibility is incorporated into the solution. This allows one to determine whether there is sufficient flexibility in the system to meet ramping requirements. Net flexibility can be calculated in two main ways (with some adjustments that can be made within each).
First, one should determine how the flexible resources are utilized in the simulation. Here, the used ramping is subtracted from the amount available. This is done for each time horizon and for each direction. For example, in a given dispatch at a particular time period, the flexibility available over three hours from the system may be 2,000 MW in upwards direction and 1,500 MW in downwards direction. If the 3-hour ramp was 1,200 MW in upwards direction, then net upwards 3-hour flexibility would be 800 MW, and net downwards would be 2, 300 MW. Note net flexibility is increased for the direction opposite to the need for that period, i.e. when an upwards ramp occurs, net downwards flexibility is increased. This is not particularly relevant as we are mostly looking for deficit periods. This calculation allows insight into how close the system actually gets to having insufficient flexibility in the specific net load time series assumed.
Another method would require to calculate the flexibility requirements as explained in Chapter 4. This can be done using percentiles, and should be also based on some type of conditional requirements (time of day/year or load level). This requirement can then be subtracted. Using the same example as before, flexibility requirements of the 95th percentile for particular time of day and wind/solar levels, may be 1,800 MW in upwards direction and 500 MW in downwards direction (if conditional requirements are used, up and down are likely to be asymmetrical). Thus, net flexibility would be 200 MW in upwards direction and 1000 MW in downwards direction. As shown, using this method is more likely to result in tighter net flexibility, however, it is designed to replicate how close operators would see the system as being to running out of flexibility. Essentially, this example shows that given a certain dispatch and knowing how the resources were used in similar situations in the past, there is a likelihood that the system will have only 200 MW of spare upwards capability.
Net flexibility is the key calculation upon which later calculations about system flexibility is available. The remaining metrics described later build upon this to understand how often this metric is likely to be negative and by how much. One should also note that one of the advantages of post processing, as opposed to calculating using a particular time series, is that the likelihood of being close to shortfalls can also be considered. In the previous example, a study could also determine how often net flexibility is less than a given amount, say 500 MW, and count this as well, as those periods may be more constrained. While the system does not run out of flexibility, it may still be worth flagging those hours as concerning. Net flexibility can also be used to determine those periods of the year that could be studied in more detail. For example, one could choose weeks with less net flexibility available and perform different sensitivities to examine how likely flexibility deficits may be under different operational assumptions.
Note that, conceptually, NFLEX could also be calculated based on the DFLEX or IFLEX concepts discussed below. Currently, InFLEXion only calculates NFLEX based on the AFLEX calculation minus the flexibility requirements. However, a similar calculation could be made by subtracting flexibility needs from either DFLEX or IFLEX to identify the NFLEX in those categories also. As this gets implemented in future versions of InFLEXion and in studies, subscripts donating the type of NFLEX are recommended (e.g. NFLEXA, NFLEXD).
Deliverable Flexibility (DFLEX)
Deliverable flexibility (DFLEX), developed by EPRI in 2015-2016 and planned to be implemented in an upcoming version of the InFLEXion tool. This concept takes into account that when the transmission network is considered, not all flexibility may be able to be deliverable. Constraints, under normal or contingency condition, may reduce the amount of power that can flow and thus also reduce the amount of flexibility that may be delivered. EPRI has developed a number of methods, from simple to detailed, to assess the reduction in flexibility that is seen when the network and the sources and sinks of flexibility are included in the calculation. More details on DFLEX are provided in the 2015 and 2016 reports ([1] and [2]), but a short description is provided below of the methods to be used.
Based on case studies carried out in the past several years, two methods are proposed to calculate DFLEX when analyzing system flexibility. Both were compared against both AFLEX to understand how they may impact on flexibility shortfalls.
- Shift factor method: Here, all flexibility resources are ranked in ascending shift factor order for lines with positive flow limits (or descending for those with negative flow limits). The total available flexibility is then added in the ranked order until each individual line is overloaded. The minimum sum of deliverable flexibility from all lines that exceed limits, or are close (based on user preference) to exceeding limits when AFLEX is fully deployed, is then given as DFLEX. This method has the advantage of speed, but is likely to have inaccuracies when significant re-dispatch is available
- Maximum Flexibility OPF: Here, each line that would have seen a limit violated if the full available flexibility was deployed is studied using an optimal power flow (OPF), where the objective function of the OPF is to maximize the overall flexibility in the system, while respecting line limits. While this is far more accurate, with only a few constraints missed, it also takes longer.
2015 studies showed results for both methods, as well as a simpler method. In 2016, EPRI continued improvements on both methods, but determine that the maximum OPF method, while taking somewhat longer, can be sped up such that its higher accuracy results in it being the most desirable method to use in the studies of DFLEX. As such, this is what is being implemented in InFLEXion.
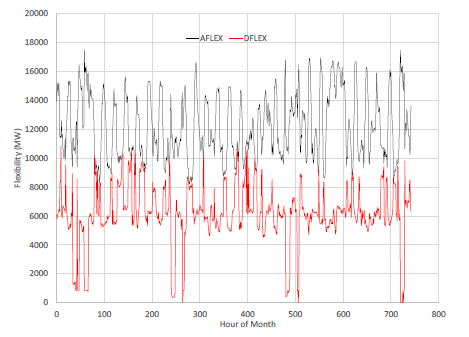
While more details on the method can be found there, it is instructive to illustrate how this calculation may impact on results. As shown in Figure 5‑2, DFLEX is significantly less than AFLEX for this particular system; note that other systems may not see as severe a difference, but in general, it would be expected that transmission constraints do limit flexibility. Depending on the type of study being performed (e.g. how far in the future it is set, whether it is assessing both transmission and resource needs, and whether it the data is available for DFLEX), this method therefore can produce significantly more detail than the AFLEX or NFLEX calculations described above. While not yet standard in various flexibility studies being carried out, once the methods are better tested (through ongoing case studies by EPRI), these methods can also be employed in flexibility assessment. In 2018, DFLEX is being added to the next version of Inflexion, to be released in early 2019.
Installed Flexibility (IFLEX)
Recently, EPRI has investigated whether one can calculate a maximum flexibility in each period of a study, regardless of the operating costs of providing such flexibility, for a given resource fleet. It is also desired to know whether such a calculation can provide an additional insight beyond AFLEX or DFLEX in terms of how system planners consider flexibility issues. This concept is still under development, with some initial ideas described in the 2016 report and expanded upon in 2017. 2018 work focused on further proving and refining the concepts using case studies to investigate the application of IFLEX.
When considering the results in AFLEX, or the flexibility sufficiency metrics described next, it is not always clear whether a flexibility shortfall is caused by the lack of a resource, or just the way the system operates a resource or set of resources. That is to say, there may be sufficient flexibility in the system resource mix, but a production cost model may not always commit resources in such a way as this flexibility is available when needed, if the operating practices simulated, and relative costs of the different resources, result in a commitment where flexibility is ‘locked away’. For example, a unit may be dispatched at its maximum stable output level, or not started-up. In either case it cannot provide flexibility until it is either dispatched down or committed. If the time horizon under consideration is not sufficiently long, then this flexibility would not be available. If sufficient numbers of units were committed or dispatched in this way, then the system may be short of flexibility in operations, even though technically there is sufficient amounts available.
EPRI developed the IFLEX method in 2016, and further expanded in 2017 and 2018, to examine this issue. Here, flexibility is maximized in the scheduling process, rather than a typical process which minimizes costs and is used for AFLEX. In both cases, demand is still met (and in the AFLEX case, any reserves or otherwise); the difference is that IFLEX maximizes flexibility while respecting generator limits. The IFLEX results can help determine how and when flexibility deficits require changes to the installed resource fleet on the system.
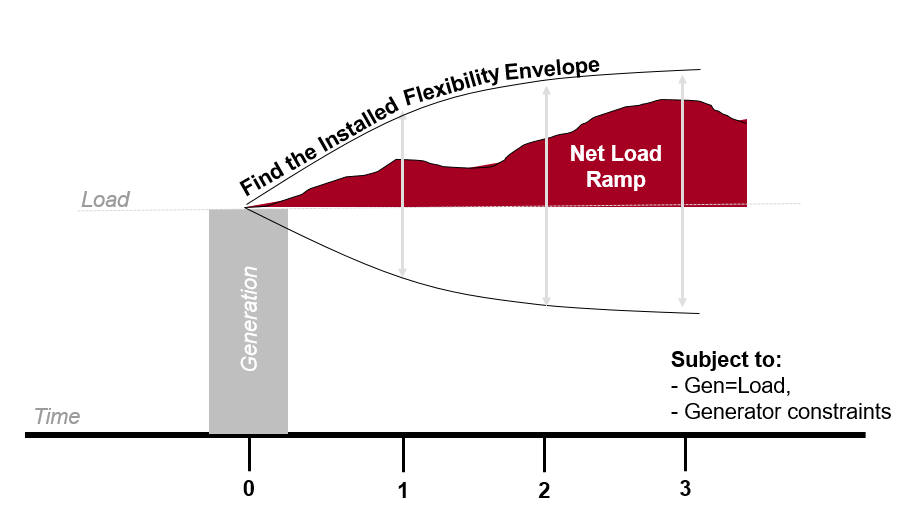
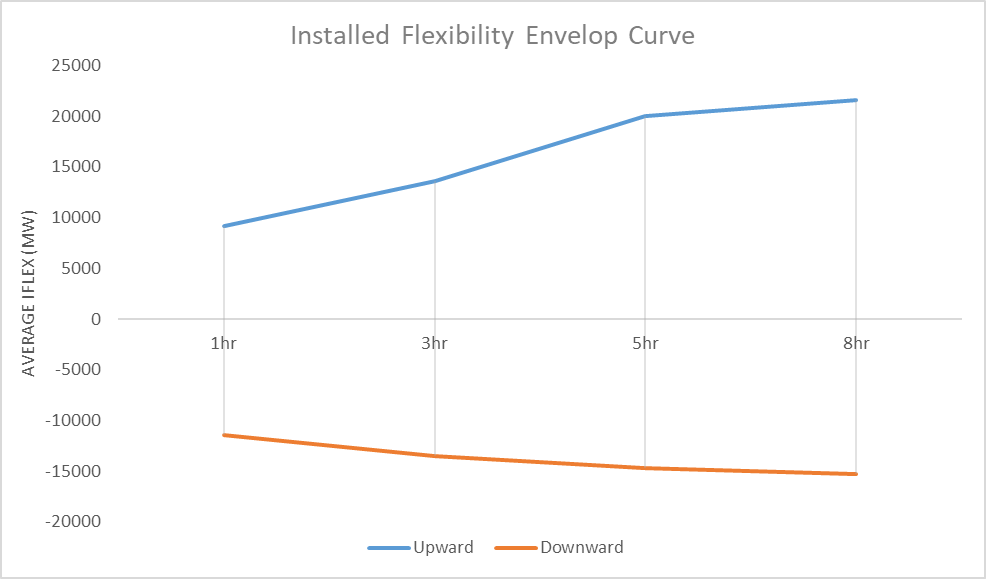
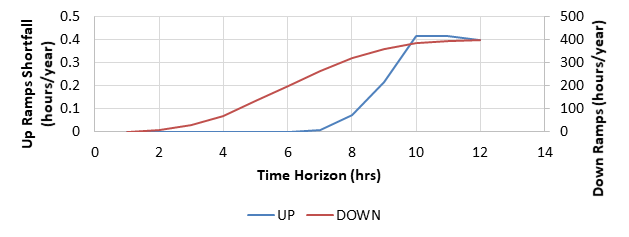
In 2018, EPRI extended the IFELX concept to develop the installed flexibility envelop for the system. An example IFLEX envelop curve is shown in Figure 5‑3. The IFLEX model maximizes the flexibility capability of the system while satisfying the load balance and all generator constraints. At t=0, the model finds the installed flexibility for each of the next 1to 8 hours (on the other hand, in Figure 5-3 it is only for the next 3 hours). If the net load ramp is within the IFLEX envelop curve, then the system has sufficient flexibility installed to deal with the upcoming net load changes. Otherwise, the net load change might be a concern to the system. The test results from an actual utility power system are shown in Figure 5‑4 for the average installed flexibility across each time horizon.
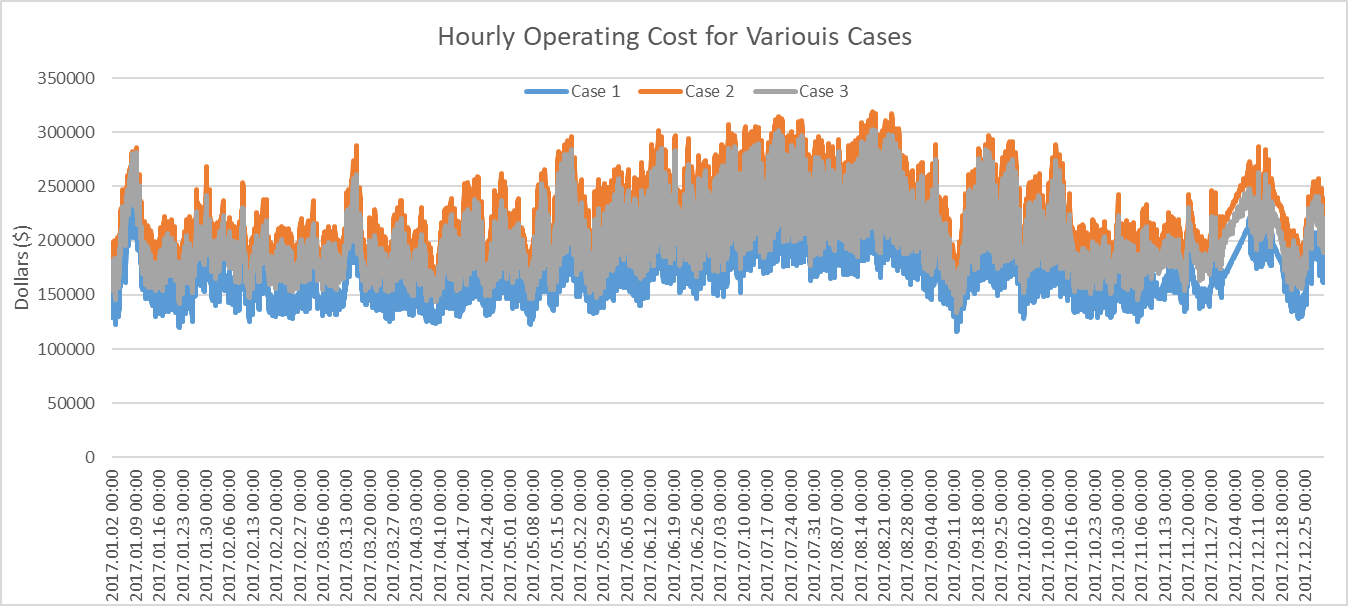
Another update from the 2018 efforts is the comparison of operation costs between the basic production cost model and the IFLEX case models. This helps understand the potential cost implications of the IFLEX bookend results, which aren’t realistic to real system operations but can provide context for how the system could potentially be operated if maximizing flexibility was the main objective. It would be expected that this could cost significantly more in operations. Figure 5‑5 compares the hourly operating costs for three test cases on a utility system used in the 2018 project work:
- Case 1: basic production cost model with objective of minimizing generation costs
- Case 2: model 1hr, 3hr, 5hr and 8hr upward IFLEX simultaneously
- Case 3: model upward 1hr and downward 1hr IFLEX simultaneously
The total annual costs of the three cases are shown in Table 5‑1. The cost of operating the system at IFLEX limit is 15%-25% greater than the current costs, with a lower cost increase when only one hour flexibility in both directions is considered; considering both directions means that not all resources are setup to provide maximum upwards flexibility when meeting load.
Table 5‑1
Comparison of operation costs for different cases
| Horizon | Case 1 (Base) | Case 2 | Case 3 |
|---|---|---|---|
| Total Annual Cost ($) | 1,529,387,051 |
1,906,297,101 (↑ 25%) |
1,761,842,913 (↑ 15%) |
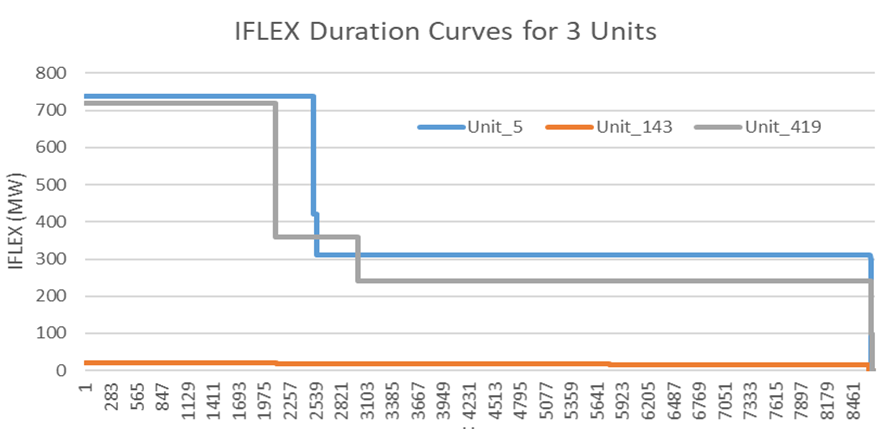
IFLEX simulations can also obtain the flexibility for individual units. The flexibility that a unit can provide varies hourly across the year, depending on the fuel type, startup time, minimum and maximum generation levels, ramp rate and minimum on time. The parameters of three selected units are shown in Table 5-2, and the 3hr-IFLEX duration curves for these are shown in Figure 5‑6. It is observed that the coal and gas units can provide IFLEX up to their maximum capacity for only 30% hour of the year. The capacity of the oil unit is relatively small, but it can provide IFLEX between 0 and its maximum capacity for all hours of the year, as it is not needed to supply demand under the IFLEX optimization.
Table 5‑2
Parameters of three selected generators
| Unit ID | Type | Startup Time (min) | Min Gen (MW) | Max Gen (MW) | Ramp (MW/Min) | Min Run Time (min) |
|---|---|---|---|---|---|---|
| Unit_5 | Coal | 1380 | 427 | 738.5 | 14 | 10080 |
| Unit_143 | Oil | 0 | 0 | 20 | n/a | 120 |
| Unit_419 | Gas | 240 | 480 | 720 | 16 | 240 |
Metrics for Flexibility Sufficiency
Once the flexibility available (here assumed to be AFLEX, but this could also be DFLEX or IFLEX) and net flexibility (NFLEX) is calculated, the next step is to develop metrics showing how likely a given system is to have insufficient flexibility. As with calculating AFLEX, this can be done in a number of ways.
In a simple screening study, one may want to consider the likely available flexibility during periods of system stress, such as peak or minimum demand. This approach is taken by the Lawrence Berkley National Lab (LBNL) study on resource planning in the Western Interconnection [20]. Here, LBNL built on methods developed by the International Energy Agency to determine peak and minimum demand periods, and then make assumptions about what the dispatch of resources is likely to be. This is done for a number of different flexibility horizons. The idea here is to identify time intervals that the flexibility is most constrained, which is the binding interval. This method has the advantage of being very simple to use, and relatively intuitive. However, it does rely on a number of large assumptions, and as such is more suitable for a high level policy type comparison of different regions and how they evolve over time (by comparing 2030 with 2020, for example). Generally, these methods can be a useful first look, but more detail based on simulation of system operations is needed to make detailed decisions.
EPRI and its collaborators have proposed a number of metrics based on the net flexibility calculation described earlier, and the likelihood of not having sufficient flexibility. These include a metric focused on frequency of shortfalls, and one focused on the amount of shortfall.
Periods of Flexibility Deficit
The periods of flexibility deficit (PFD) is a measure of the number of periods when AFLEX is less than the required flexibility for a given time horizon and direction; note this could also be calculated by comparing DFLEX or IFLEX, but here the assumption is to use the AFLEX calculation, as this is what is currently calculated in InFLEXion. The PFD is calculated for a range of user selected time horizons in both directions. It can also use different percentiles, or different conditional flexibility requirements, in order to understand how results change depending on assumptions used.
PFD represents the frequency that there is a risk of insufficient flexibility. It does not look at how much the shortfall is, but is similar to Loss of Load Expectation (LOLE), in that it shows how often it happens. Currently, when calculated in InFLEXion, every period that has a shortfall counts towards the metric. This is different than LOLE where it is only based on number of days when there is a shortfall, regardless of the length of the shortfall. In the future, one could adjust this to be more focused on days in ten years, or similar, but at present each period is examined as flexibility issues may occur more than once per day, whereas capacity tends to be a daily issue.
PFD can be calculated based on what actually happens in the realized wind/solar/load time series, where it would be a deterministic metric. It could also be calculated by comparing the flexibility available to a potential requirement, based on percentiles and/or conditional requirements. The probabilistic calculation is expected to have a higher number of shortfalls, as one is comparing the available flexibility to what may happen. Example results are shown for an example system in Figure 5‑4. As shown, there is likely to be a shortfall less than once per year in the upwards direction, but several hundred in downwards direction, particularly for longer time horizons.
Expected Unserved Ramping
Using the same calculation as for PFC, Expected Unserved Ramping (EUR) is calculated by adding up the MW shortfall for each time horizon of interest and direction. Sensitivities about requirements, based on what actually happened or on different potential ramping requirements based on percentiles and conditions, can also be studied to ensure the range in results based on assumptions is examined. EUR reports in MW per year, as it is a shortfall in capacity. One can then determine average MW shortfall in each period. Note that, if the shortfall described by EUR is relatively low compared to a case with the same PFD but higher EUR, then this is less of a concern, so both EUR and PFD should be considered together.
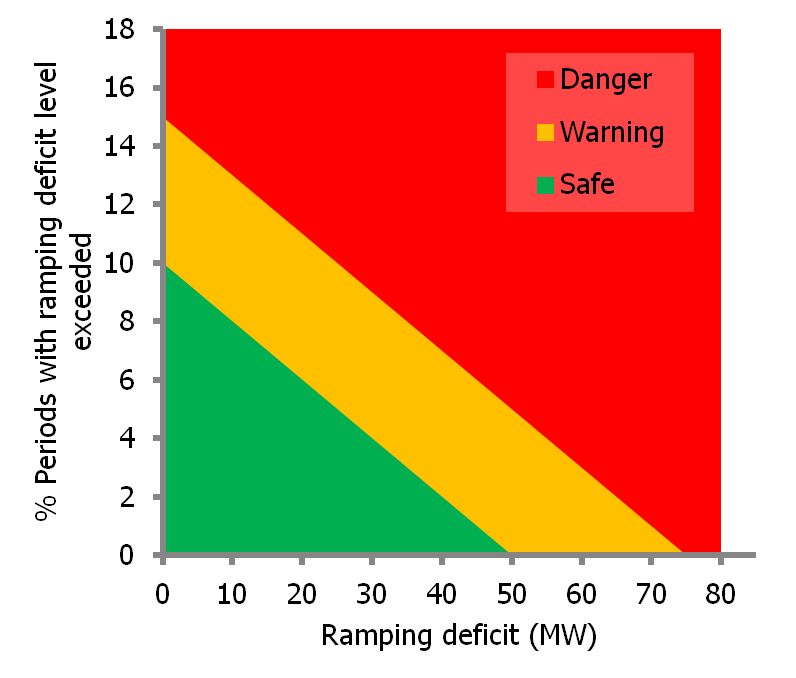
InFLEXion provides the ability to graph these against each other in a ‘well-being’ analysis, so one can look at how these change over time, or with different requirements or time horizons. An example is given in Figure 5‑5 that shows a case where if the deficit is less than 50 MW over the study period, and less than 10% of the periods see a shortfall, the result is deemed ‘safe’. Slightly higher shortfalls or periods are given a ‘warning’ label and higher shortfall frequency or deficits are considered ‘danger. These are qualitative measures, and as such will need some time, and numerous studies, before a good understanding developed as to what constitutes safe, warning and danger. Users should likely baseline methods, as described later, so they can determine how changes to the system can impact on results.
Including Flexibility Metrics to Guide System Development
Previous chapters have shown how flexibility may fit in the planning process, and how one can assess the requirements for and availability of flexibility resources based on detailed approaches such as production cost modeling and more simplified approaches. As shown, methods have been developed, and are still developing to answer those questions. However, the next step will be to then use these methods to inform system development – the ‘so what?’ part of the equation. While the answer to that question will evolve as the usage of the metrics becomes more widespread, this Chapter describes some of the current thoughts on the process, based on EPRI research, member interaction and other industry progress. This is described in the form of two key questions that would need to be answered.
How does flexibility compare with capacity?
It is clear from various studies and other efforts that flexibility will soon need to be considered in the planning process. Typically, planning processes have been more concerned with the need for capacity, whether generation or transmission (or more recently demand response could cover such capacity needs). With the need for flexibility, the question becomes whether it is a form of capacity or should be a new type of adequacy need, that can be solved by either changing operational practices or procurement of new resources.
An example of recently completed work attempting to answer this question for a specific region is the CES-21 project described earlier, where SERVM was used to study flexibility in California. There, the main purpose was to determine whether California would need to adjust its planning standards. Currently, these standards are focused on ensuring a Loss of Load Expectation (LOLE) of 1 day in 10 years. This implies that, over a 10-year period, only 1 day would be expected to see interruptions to service, which are defined as periods when there is insufficient capacity to meet load and operating reserves. Typically, these calculations can be done by assuming every hour is independent, and determining the likelihood of not having capacity based on unit outage statistics. However, by using SERVM, the temporal variation in demand and generator availability can be examined using time series approaches. This allows for understanding of how resources operate from one hour to the next, and thus can also be used to study whether there is sufficient ramping capability.
The CES-21 study examined whether, even though a system may have sufficient capacity, there could be loss of load due to ramping. In general, it was shown that existing planning standards can still ensure reliability, assuming the relevant components are calculated sufficiently. The project’s analysis does show a need to consider intra-hour and multi-hour ramps more explicitly in long term planning, but the Planning Reserve Margin (PRM) techniques developed and used previously can still provide useful indicators of resource adequacy. PRM is the process where a system is considered resource adequate if its total installed capacity is a certain percentage (typically 15%-20%) above peak demand. Specific recommendations to come out of that project included:
- PRM is still a useful metric to assess adequacy, but the Effective Load Carrying Capability (ELCC) of all resources needs to be accurately calculated and used in the calculation in order to be accurate. This means, for example, that wind and solar power would not contribute all of their capacity to PRM, but only a suitable amount based on their ELCC, calculated using a probabilistic resource adequacy approach.
- Sufficient load following capability must be carried in order to ensure intra-hour flexibility sufficiency. There is also a potential tradeoff between reliability and economics in calculating requirements.
- Use of new metrics such as LOLEIntra-Hour (loss of load shown in SERVM due to shortfall of intra-hour reserves) and LOLEMulti-Hour (shortfall in SERVM due to large multi-hour ramps being greater than the capability of scheduled resources) were developed here. These allow for greater understanding of the flexibility needs and resources, and are similar to PFD and other metrics described earlier from InFLEXion, with the difference being they are included in the model rather than post processed. How these relate to LOLECapacity, which is a pure capacity shortfall, needs to be further considered.
Thus, conclusions in that project are that, assuming the system is modeled in sufficient detail, operational flexibility can be included in the loss of load calculation. However, other sensitivities in that modeling approach do show that flexibility characteristics, such as ramping and minimum load capabilities of generation, can impact results, and thus there is some link between flexibility and capacity needs. These will continue to be investigated in California study work, including in the ongoing IRP proceedings there. One additional recommendation is to use the framework developed in CES-21 to investigate outcomes of less detailed IRP tools on a regular basis. One issue that arises in that project, and similar projects, is whether 1-day-in-10 is a suitable expectation for flexibility deficiencies. While for capacity, this would result in load or reserve shortfall at peak times, running out of flexibility may only mean a shortfall in reserves for a few minutes. As such, it is not clear that the same metric should be used. In CES-21 this was recognized by using different subscripts for LOLE it is used, it is still to be determined whether capacity and flexibility shortfalls should be added together and be lower than a certain amount in total or whether they should both be counted separately, given the different implications of being short of capacity compared to flexibility. Ongoing studies should help to answer that question.
One way to think about it is to determine the values of the above metrics for a system that seems adequate. For example, for capacity, a system with 1-day-in-10 years does not actually see exactly one day when load cannot be met every 10 years; rather industry uses this method based on experience that a system meeting this requirement appears to provide enough capacity over time. For flexibility, a similar approach will need to be determined. The challenge is to determine what the baseline should be. If a current system has sufficient flexibility, or some system in the future has been studied in sufficient detail, then future systems at least should not perform any worse than this value, or some other value close to this that is deemed acceptable. For example, if PFD were calculated to be 2 hours per year, and simulations showed the system appeared to work as expected, then this could be used to benchmark further studies. Another approach would be to use historical data and determine how much better or worse future systems are at meeting requirements. This trend, while it will not give a specific standard, can at least allow users to determine how things change over time. This seems like an appropriate first step to take.
Another difference in flexibility and capacity is that different time horizons may show different flexibility shortfalls. As such, one should determine whether there is a specific risk at longer time horizons that may be more acceptable than shorter time horizons. Longer time horizons can be solved by improving forecast accuracy, altering commitment strategies, and others; whereas shorter time horizons (e.g. less than an hour) may be more about changing reserve requirements. The standards could then be adjusted based on time horizon, again by benchmarking existing systems or systems the planner is comfortable will have sufficient flexibility. Direction should also be considered, given the fact the upwards ramping may be more of a reliability issue than downwards ramping, which is typically more economics focused.
Interpreting results
Once the flexibility assessment calculations are performed, one needs to be able to interpret results. Interpretation can come in two main flavors: i) first, one may use the results to determine whether a system is reliable (in the adequacy sense); and ii) second, they may use results to determine whether and how flexibility should be increased. For the reliability/resources adequacy question, as mentioned, one of the first things that would need to be done is to baseline existing systems and/or systems that planners are comfortable has sufficient flexibility. This is somewhat subjective, but allows for planners to determine a baseline. While there is no specific baseline that should be used equivalent to a 1-day-in-10 LOLE at present, it is expected that as studies and experience progress, baselines will appear for metrics such as PFD, EUR, IRRE and other metrics that will be proposed in the coming years. What is not entirely clear, at the moment, is whether these will be universal in the way LOLE is, or whether they will be specific to a given region, given its resource mix, renewable targets, and operational processes, among other characteristics. Initial studies by EPRI on a variety of systems indicate some commonalities.
For example, deficits tend to increase in magnitude as time horizon increases, up to the point at which large units can come online, e.g. an increase in deficits between one and three hours in a system with a large number of four hour starting generators. These longer time horizons may need to consider things like forecast accuracy when determining standards, where requirements are based on uncertainty as well as variability. Downwards ramping, which can be solved with wind/solar curtailment or improved dispatch response from conventional generation and net imports at relatively low costs, also typically shows up as being more of an issue, and thus may have a less stringent standard. The calculations that imply a shortfall also vary, with some regions using 99th percentile of all time periods, while others being more condition-focused. Clearly, a more stringent requirement would result in a higher likelihood of flexibility shortfalls, such that the standard used should be carefully considered to line up to reality. As of this report, it would still be recommended to do a set of initial studies, with sensitivities about requirements and the flexibility available. Planners can then get an understanding of what the standard they should develop should be.
Both the size and frequency will impact on what decisions could be made for the results. For example, infrequent small deficits may be acceptable within a certain measure of risk, and it may be acceptable to have those violations, and assume that in operations the flexibility risks will be mitigated. On the other hand, infrequent large deficits may be more concerning, and if further studies show a continuation of large deficits, even infrequent, then it may be necessary to determine whether a low capital cost resource such as demand response or CTs could be used to meet the deficit. Downwards ramp may require one to examine the economics of wind and solar and determine whether different locations or resources (wind instead of solar, for example) would provide more optimal results.
More frequent deficits would obviously imply a greater risk to the system. If these are small, then some combination of operational changes could be investigated, such as reserves, increased resolution in intertie scheduling or improved forecasting methods being integrated into operations. Larger, frequent deficits would be of most concern. The first recommended step would be further study, using more detailed production cost tools, or altering assumptions in the production cost tools (e.g. improved forecasts based on expected performance of forecasters in future or dispatch responsiveness of renewable generation). This would allow for study of the tradeoff between the need for new resources and operating strategies that increase flexibility. If shortfalls were still large and frequent, then one would need to look at adding additional resources to the system to meet these requirements that result in a net addition of available flexibility during the times when the flexibility shortfalls occur. As they would be frequent shortfalls, low capital cost resources that would be available during the periods when flexibility is needed, which may be mid merit type generators, could be used to address shortfalls.
The time horizon of shortfalls also matters. In general, alleviating shortfalls on shorter time horizons should contribute to reducing shortfalls on longer time horizons by freeing up more flexibility (unless significant energy limited storage is used, in which case longer horizons may be more significant). Clearly, certain solutions, such as longer start resources, are better used for longer time horizons. The example of Ireland mentioned earlier is useful here, where multiple ramping products are being incentivized to capture different time horizons. As such, it will be important to select a number of the most relevant time scales to examine. Typically, this includes one hour, one horizon from three to five hours (to cover units that start relatively quickly as well as to cover typical lengths of evening or morning ramps), and one time horizon from six to ten hours (to cover the length of time from low to high load in a day, as well as longer start generation). However, other time horizons may also be relevant, depending on results.
Another aspect to consider here is when the shortfalls appear. For example, if shortfalls happen during the same time period on may weekdays for a certain season, this may lend itself more readily to upgrading a particular unit to be able to reach lower minimum generation levels, or may encourage the procurement of demand side flexibility from demands that are potentially flexible in those regions.
As discussed earlier, it is not just periods when there is a negative net flexibility that are important. Other margins may also need to be considered, either in calculating net flexibility or when considering the results of metrics such as PFD or EUR. For example, one would always need to ensure contingency reserves are covered, and likely would want to cover any reserves to be used within the time interval studied, for example regulating reserves. This could be done by not counting the spinning reserves towards flexibility resources, if these are known, or one could subtract this out after the fact.
When examining the results, it may also be the case that a period counts as a deficit if there is insufficient flexibility in that period to meet a combination of flexibility requirements, contingency and regulating reserves. For studies with lower resolution data (e.g. one hour), within hour requirements may also need to be subtracted out. Based on all of the above, it is likely that metrics should be calculated based on both specifically running out of flexibility (net flexibility less than zero), but also with certain margins added (e.g. how often there is less than 200 MW of flexibility). This can better allow planners to understand how close they are to having insufficient flexibility. However, when interpreting results, one needs to be aware of the settings they chose and the impact that could have.
Such margins may allow for better consideration of the economics of different flexibility options, which gets to the flexibility procurement issue described above, which is the second way to use results of flexibility assessments. This is where, instead of just considering flexibility sufficiency, results are also used to identify the best means to increase system flexibility. Here, flexibility can be increased in different ways, from changing operating practices, to retrofitting existing plant, to procuring new resources. The costs and benefits of different options could be considered by looking at how much they improve shortfalls or increase flexibility margins.
The metrics described earlier can help identify new resources to include in future production cost modeling exercises, such that the options most useful to add flexibility and can be compared on an equal operating and investment cost before making decisions. This also could lead to the development of ‘flexibility drive cycles’ in the future, where the flexibility required is broken down into a set of different types of resources (e.g. two shifting, baseloaded, reserve providing, etc.), like the current baseload/mid-merit/peaking paradigm. If such drive cycles were identified, then it would allow planners to better understand the type of new resources required (at the simplest level, it may mean requiring x MW or MW/min of ‘base’ flexibility, y MW of two shifting flexibility, and so on, though it is unlikely to be as simple as this).
The economics of different means to increase flexibility is not as well considered in the EPRI methods to date, while other studies and methods typically consider these using sensitivity analysis in simulation models. EPRI is continuing to work on potential methods to include flexibility assessment results in consideration of ways to increase system flexibility, through resource expansion and other means, and will update these guidelines accordingly.
One final note about interpreting results is that these can also be used in organized markets such as ISO regions, or at a policy level, to inform whether there is need to incentivize more flexible behavior from system resources. Results may show, for example, that there is sufficient flexibility available in the resource mix, but that typical dispatches based on current practices (market rules in an ISO) do not result in sufficient flexibility being available. This may inform the development of a new type of ancillary service, changes to existing services, or altering operating practices. As such, sensitivities as described earlier can be used to determine the need for and value of changing business practices. For example, in the case of the Irish system services redesign, production cost simulations were used to help determine that 1, 3 and 8 hour ramps should be incentivized.
InFLEXion has a number of means of interpreting results. Of particular note, based on the metrics above, is a means to graph PFD and EUR on the same figure, for different horizons and directions. This “Well Being Analysis” can be used to show how flexibility varies across time horizons. InFLEXion allows users to set what warning (orange) and danger (red) levels may be. This can be used to help with the benchmarking identified above.
Summary
This Chapter highlights some key points to consider when interpreting flexibility metrics:
Create baseline metrics against a familiar system. Using historical or well-studied future power system data, calculate flexibility metrics in a range of time horizons and in the upwards and downwards directions. In the absence of established standards, and questions about the global application of flexibility requirements, this baseline provides a valuable point of comparison for future systems.
Consider the implications of flexibility deficits compared to capacity deficits. Capacity deficits result in unmet operating reserve requirements, use of price responsive demand and eventually, involuntary load shedding. Flexibility can have similar issues, but at different times of the day and usually with warning such that involuntary load shedding can be avoided.
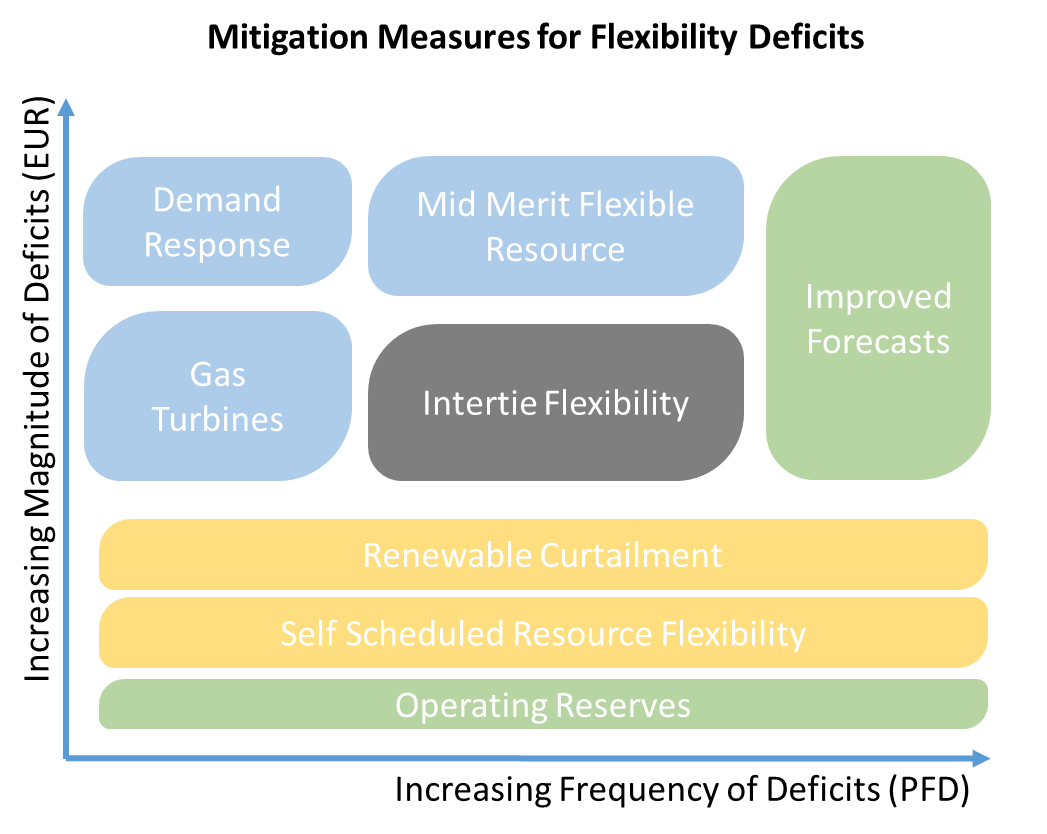
If a concern about system flexibility does arise mitigation measures, as shown in Figure 6‑1, depend on: the direction, the time horizon, the frequency of deficits and their magnitude.
Downwards flexibility can be managed through reserves, improved operational forecasting, curtailment and improved dispatch response from self-scheduled units and interties.
Upwards flexibility can be managed through reserves, improved operational forecasting, intertie flexibility and new resources.
Frequent and small violations can be met by operational changes such as reserves.
Frequent and large deficits can be met by new resources that contribute to net available flexibility
Infrequent and small violations can be met by special operating procedures or reserve requirements
Infrequent and large deficits can be met by low capital cost resources that add to the net available flexibility such as demand response and gas turbines.
- Flexibility procurement, or resource expansion that considers flexibility, is still under development, but the methods described here for flexibility sufficiency assessment should form the basis of procurement of new resources, retrofit of existing resources or alteration to business processes. The relative economics of each can be considered using detailed operational simulations.
=
Conclusions and Further Work =
This technical update provides an initial description of guidelines for inclusion of operational flexibility issues in power system planning. With increasing levels of renewable generation, particularly wind power and solar PV, variability and uncertainty may become increasingly challenging to manage. Planners will potentially need to consider these issues in more detail, and the focus of this update is to provide guidance for planners to include flexibility in planning, based on EPRI experience and methods developed over the past several years.
- ↑ 1.0 1.1 System Flexibility Assessment and Analysis. EPRI, Palo Alto, CA: 2015. 3002005763.
- ↑ Strategic and Flexible System Planning – 2016 Update: Deliverable Flexibility and Flexibility in Resource Adequacy. EPRI, Palo Alto, CA: 2016. 3002008379.
- ↑ Cite error: Invalid
<ref>tag; no text was provided for refs namedF15
